Which restaurant KPIs matter most?
The KPIs that matter most for a restaurant group are sales (broken into guests and average check), prime cost, food cost, labor as a share of sales, and a short list of operational checks that tell you whether the site is running to your standard. Prime cost is food and beverage cost plus all labor, the two biggest lines you control. WhippleWood CPAs puts it at 55% to 65% of revenue and says operators above 65% have a structural problem that menu tweaks won't fix.
Why bother with a short list? Because margins are thin. The National Restaurant Association's State of the Restaurant Industry 2026 report says 42% of operators reported their restaurants were not profitable in 2025, and more than 6 in 10 said customer traffic declined against 2024. Only about 15% saw an increase. When traffic is soft and costs are high, a site can drift from fine to losing money inside a quarter, and a quarterly P&L tells you after the fact.
Here's a working set for a group, with what each number is built from:
| KPI | How to calculate it | What it tells you |
|---|---|---|
| Net sales | Sales before tax and tips, by day | Volume, and whether the day went to plan |
| Guests (covers or checks) | Count of guests or paid checks | Whether people are coming back |
| Average check | Net sales divided by guests | Pricing, mix, upselling |
| Food and beverage cost % | Cost of goods used divided by food and beverage sales | Purchasing, portioning, waste, theft |
| Labor % | All labor cost divided by net sales | Whether staffing fits the volume |
| Prime cost % | (Cost of goods used plus all labor) divided by net sales | The one number that tells you if the site makes money |
| Waste | Logged waste in dollars, with a reason | Where the food cost is leaking |
| Tasks done on time | Scheduled tasks completed before they were due, divided by all scheduled | Whether the standard is being run |
Sales split into guests and average check deserves a line of its own, because the two move for different reasons. BJ's Restaurants reported in its fiscal 2025 10-K that comparable restaurant sales rose 2.0%, made up of guest traffic up about 2.8% and average check down about 0.8%. The company says the check fell because of its Pizookie Meal Deal platform and growth in a late-night daypart, which drew guests who spend less per visit. A sales number alone would have hidden that trade.
Count food cost on cost of goods used, not purchases: opening inventory plus purchases minus closing inventory. If you don't count stock, food cost is a guess. The inventory guide covers the count itself.
Which KPIs do you check daily, weekly and monthly?
Check sales, guests and labor every day, prime cost and food cost every week, and the slower numbers (turnover, training completion, review ratings, sales trend by site) every month. The cadence follows how quickly you can still fix the problem. Labor can be adjusted tomorrow; a food cost problem takes a week of counts to see; an unhappy trend in reviews builds over weeks.
| Cadence | Numbers | The question |
|---|---|---|
| Daily (site manager) | Net sales vs the same weekday last week or last year, guests, average check, labor %, tasks overdue | Did today go to plan, and what do I change tomorrow? |
| Weekly (owner or operations lead, one meeting) | Prime cost %, food and beverage cost % from counts, waste in dollars, comps and voids, checklist completion by site | Which site drifted, and who calls that manager today? |
| Monthly (owner and managers) | Full P&L by site, same-store sales, turnover, training sign-offs, review ratings, audit scores | Is the whole group moving the right way? |
One thing to settle early is the labor number. Labor has a fixed part (a minimum crew has to be there whether you sell $60,000 or $120,000 in a week) and a variable part. Say a site has a $12,000 weekly floor and variable labor of 15% of sales. At $60,000 a week, labor is $12,000 plus $9,000, which is $21,000, or 35% of sales. At $120,000, it's $12,000 plus $18,000, which is $30,000, or 25%. The same site, the same crew rules, and a ten-point swing in labor percent from volume alone. So don't set one labor percent target for every site and every day; set labor hours against expected sales, and read the percent as a result.
A daily read only works if the numbers show up without anyone asking. If the owner has to message six managers for yesterday's sales, the daily review is weekly by the second week.
How do you compare locations fairly?
You compare locations fairly by putting them on the same definitions, the same calendar and the same age. Three things break a comparison most often: sites at different stages of their life, cost lines booked differently, and volume differences that turn a percentage into a false signal.
Start with age. BJ's, in the same 10-K, says full-service restaurants often open well above their sustainable run-rate, a "honeymoon" period, and that it may take up to three years for a new restaurant's sales to settle. It also says new restaurants usually need a year or longer to reach their targeted restaurant-level operating profit because of cost of sales and labor inefficiencies. That is why public chains don't compare a new site with a mature one. BJ's puts a restaurant in its comparable base after 18 months. Darden's same-restaurant sales measure is limited to restaurants open and operated for at least 16 months. You can set your own rule, but set one, write it down, and keep new sites out of the same-store line until they pass it.
Then the calendar. Compare the same weekday against the same weekday, and compare 52-week years, so a Saturday in one period isn't set against a Tuesday in another. Darden says its same-restaurant sales are a year-over-year comparison of each period's sales volumes for a 52-week year. Holidays and local events (a festival, a road closure) go in a note next to the number, not into a hidden adjustment.
Third, definitions. If one site books its linen service under cost of goods and another under operating expense, prime cost is not comparable. Write a one-page definition for every KPI: what goes in, what stays out, who counts, and when. Then:
- Count all inventory on the same day of the week and in the same way at every site.
- Book staff meals, comps and voids to the same lines.
- Use the same labor definition: wages plus payroll taxes and benefits, or wages only, but never a mix.
- Report sales net of sales tax and tips, so the number means the same everywhere.
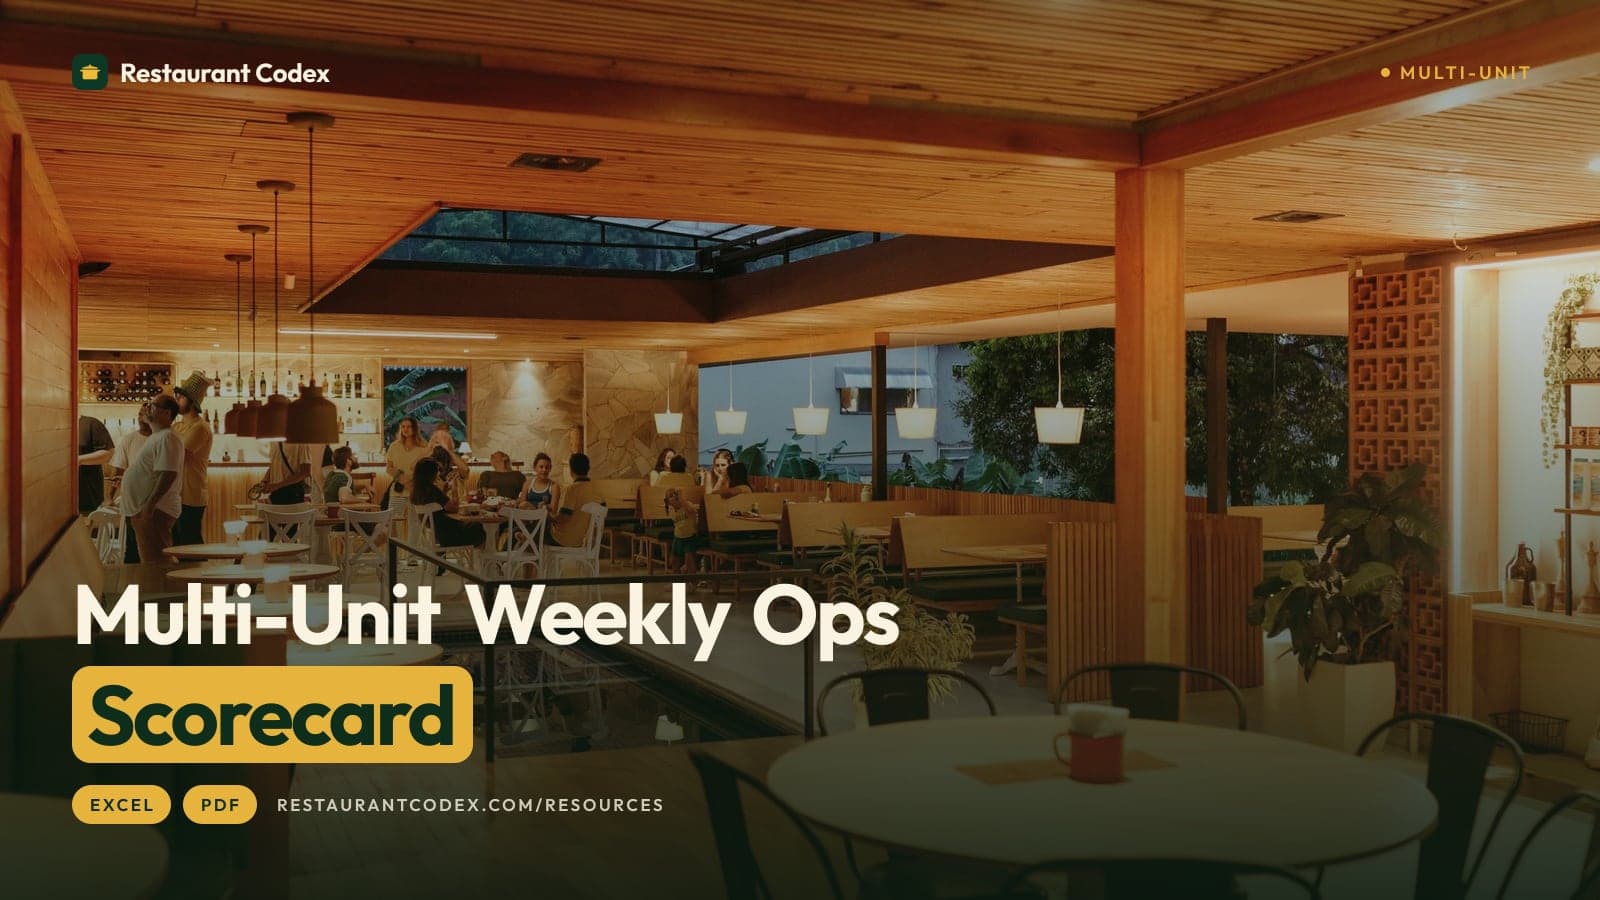
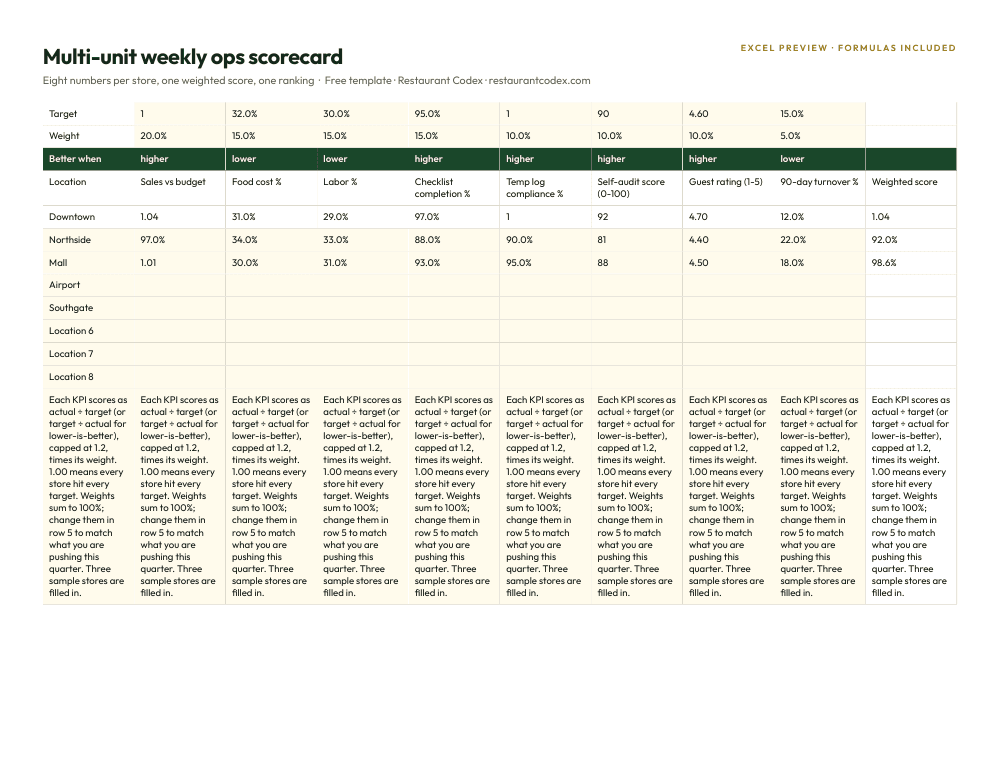
Finally, rank on dollars as well as percentages, and compare sites of similar size and concept first. A small site that runs 28% food cost on $50,000 a week and a large one at 31% on $150,000 aren't telling you what you think: the second one loses more dollars to the gap. You'll find the same logic in the multi-unit weekly scorecard, which puts every site on one page. For the wider picture of running several sites, see how to run a multi-location restaurant group.
What operational KPIs matter beyond sales?
Beyond sales, the operational KPIs that matter are the ones that show your standard is being run: tasks done on time, counts completed, waste logged with a reason, and training sign-offs. They are leading indicators. Food cost and labor tell you what happened last week; whether the opening checklist was done by 10:00 tells you what will happen next.
Pick numbers you can verify without trusting the person who reports them:
- Checklist completion and timeliness. The share of scheduled opening, closing and cleaning tasks done before they were due. Photo proof on the tasks that matter turns it from a self-report into evidence.
- Count completion. Did each site count on the scheduled day, and how big was the variance against what the recipes and sales say should have been used? The variance method is a few lines of arithmetic.
- Waste logged, with a reason. Dollars by reason (spoiled, overproduced, dropped, returned). A site that logs nothing for a month isn't wasting nothing.
- Training and sign-off completion. What share of the people on shift have been signed off on the station they're working. Staff turnover and onboarding have their own guide.
- Speed and table use. For sit-down sites, revenue per available seat hour (RevPASH): the revenue earned for each seat in each hour. In their 1999 paper in the Cornell Hotel and Restaurant Administration Quarterly, Kimes, Barrash and Alexander describe the aim of restaurant revenue management as maximizing RevPASH by managing price and meal duration.
- Guest feedback. Review rating and the count of complaints by site and cause. Reviews matter in money terms for independents: Michael Luca's Harvard Business School working paper found that a one-star increase in a Yelp rating led to a 5 to 9 percent increase in revenue, an effect driven by independent restaurants, with no effect for chain-affiliated ones. That study used Washington State tax data, so read it as a signal, not a promise.
That's why operational KPIs belong next to the financial ones. Two sites can show the same 31% food cost this week: one with all counts done, waste logged and a closing checklist at 98%, the other with a count skipped and no waste entries. The first number is real and the second is a guess, and without the operational KPIs you can't tell which is which.
How do you build a KPI dashboard for several locations?
You build a KPI dashboard by choosing the ten or so numbers from this guide, defining each one in writing, and getting each from the system where it is first recorded, so nobody retypes it. The rest is layout: one row per site, one column per KPI, the group on top, and a color only where the number needs a decision.
Steps that work:
- Write the definitions first. One page, one line per KPI: formula, source, owner, cadence. Everything later depends on it.
- Decide where each number comes from. Sales and guests come from your point of sale. Cost of goods comes from invoices and counts. Labor comes from payroll or scheduling. Task, waste and training numbers come from the system where the work is done.
- Make one row per site and one line for the group. Put the sites side by side, so the outlier shows. Add the previous week and the same week last year in small type.
- Set a range, not a point. For each KPI, a range for green, amber and red, set by concept. Your own last-quarter average for the site is a better baseline than a published benchmark, which is usually a U.S. average.
- Attach an action to each color. Red labor on Tuesday means the manager changes Wednesday's schedule. Red food cost means a recount. If a red has no action, drop the KPI.
- Review on a fixed rhythm. The same page, the same meeting, the same person leading it, every week.
A spreadsheet is a fine start for two or three sites. It breaks when inputs are retyped by hand, when two people edit the same tab, and when formulas drift across sites; the software guide lays out what each kind of tool does.


Which KPIs mislead?
The KPIs that mislead are percentages without dollars, group averages that hide one bad site, sales growth that is really price, and any number a manager can move without changing the business. Each is easy to fix once you know to look.
Percent without dollars. Take two dishes. One sells at $10 with $3 of food cost, which is 30%, and leaves $7 of margin. The other sells at $20 with $8 of food cost, which is 40%, and leaves $12. The 30% dish looks better and earns less per plate. A site chasing a lower food cost percent can end up with less money in the till. Track dollars of gross margin next to the percentage, and see the menu engineering guide for how to read a menu this way.
Mix hiding in a blended percentage. Say two sites each run a 31% food cost and 22% beverage cost. Site A sells $70,000 of food and $30,000 of beverages in a week; site B sells $85,000 of food and $15,000 of beverages. Site A's blended cost is $28,300 on $100,000, or 28.3%. Site B's is $29,650, or 29.65%. Same discipline in the kitchen and bar, a 1.35 point gap from mix alone. Compare food to food and beverage to beverage before you question a manager.
Sales growth that is just price. The National Restaurant Association expects 2026 restaurant and foodservice sales of $1.55 trillion, up 4.8% on 2025, and says much of that growth is expected to come from menu pricing rather than more traffic, with real growth after inflation at 1.3%. If your sales are up 4% and guests are down, you didn't grow. Split every sales change into guests and average check. As a worked example, a site that goes from 1,000 guests at a $40.00 average check to 980 guests at $42.40 has sales of $41,552 against $40,000. That's up 3.9% in sales with a 2% drop in guests. Read one way it's a good week, read the other it's early warning.
A group average over one bad site. A group at 61% prime cost can have seven sites at 58% and one at 80%. Always show the worst site and the spread, not just the average.
Numbers a manager can game. Labor percent can be cut by sending people home early and losing service. A food cost number can improve by delaying a count. Pair every cost KPI with a quality check, such as a mystery-shopper score or the checklist record, so lowering one number can't quietly damage another. Counting tasks "completed" without proof of the work has the same flaw. The operations audit guide covers how to verify that what's reported is what happens.
A single average for different concepts. The 28% to 35% food cost range WhippleWood gives is a general range. A pizzeria, a seafood place and a coffee shop don't share one target. Set the range per concept and per site.
Where Restaurant Codex fits
Restaurant Codex covers the operational half of a KPI dashboard and the cost half that comes from invoices and counts. Operations assigns scheduled checklists with photo proof, sends due-soon, overdue and still-not-done alerts, and gives the owner a side-by-side view of every location with a live activity feed: that's where your tasks-done-on-time number comes from, with proof behind it. Inventory reads supplier invoices line by line and flags price increases, runs blind counts on a phone, logs waste with a reason, and shows food cost per location with a roll-up for the group. Training sign-offs and readiness by location and role come from Training.
Restaurant Codex isn't a point-of-sale, accounting, payroll or scheduling system, so net sales, guest counts and labor hours still come from the tools you already use. You can start Inventory without a POS feed. To see it all on one page, read how Restaurant Codex works for multiple locations.
Restaurant Codex
The same checklist, on every phone, with photo proof
Restaurant Codex runs this template as a live task with timestamps, photos and one view across every location. Bring it to a 30-minute working session and we'll show you how it would run across your locations.
By the Restaurant Codex team
Written with operators who run multi-location restaurant groups. Reviewed against the FDA Food Code and the sources listed below.
Sources
- National Restaurant Association, State of the Restaurant Industry 2026 (full report)
- National Restaurant Association, press release on the 2026 industry outlook
- BJ's Restaurants, Inc., Form 10-K for fiscal 2025 (SEC EDGAR)
- Darden Restaurants, Inc., Form 10-K for fiscal 2026 (SEC EDGAR)
- WhippleWood CPAs, Restaurant Financial Benchmarks: Key Metrics Every Owner Should Track (updated April 2026)
- Kimes, Barrash and Alexander, Developing a Restaurant Revenue-management Strategy, Cornell Hotel and Restaurant Administration Quarterly, 1999
- Michael Luca, Reviews, Reputation, and Revenue: The Case of Yelp.com, Harvard Business School Working Paper 12-016