Two numbers you actually control, added together
Two restaurants can post the same 32% food cost this month and be in completely different shape. One of them is running 38% labor on top of it; the other is running 30%. The first one is losing money on prime cost even though its food number looks fine on paper, and nobody catches it, because food cost and labor cost live in separate reports that nobody adds together until the accountant closes the month, weeks after the schedule that caused it.
Prime cost is cost of goods sold plus total labor, added into one number, because those are the two costs you actually make decisions about every week. Rent is fixed. Insurance barely moves. Prime cost moves with every invoice you sign for and every shift you schedule, which is exactly why it deserves its own weekly number instead of a line buried in next month's statement.

Prime cost and weekly P&L tracker
13 weeks, one row per week: sales, COGS, labor and prime cost against your own target · formulas included

Weekly flash report
One page: the week's sales, cost of goods, labor and prime cost, signed off by the GM · 7 sections
How this gets filled out on a Monday morning
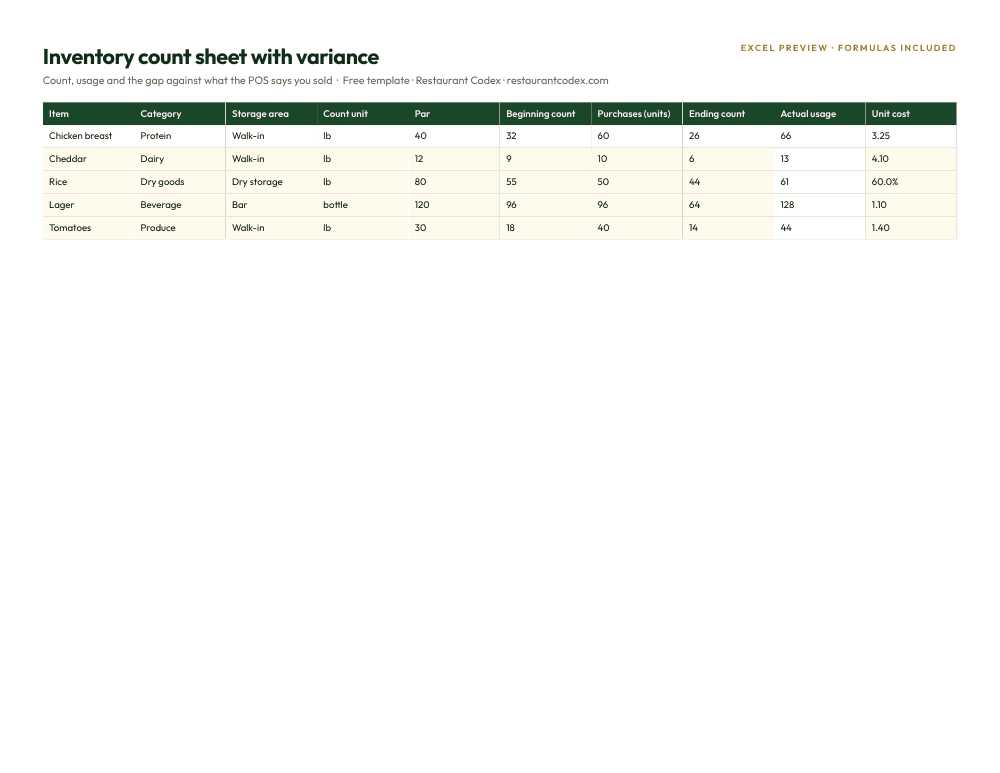
The tracker takes about 20 minutes once you know where the numbers live. Net sales and covers come off the POS week-end report. Food and beverage purchases come off this week's invoices, not a running estimate. The inventory change comes from Friday's or Sunday's count, whichever day you close the week on, so pair this with the inventory count sheet if you don't already have one. Hourly and salaried labor, plus payroll taxes and benefits, come off payroll or the POS labor report, whichever your system totals more cleanly. Whoever runs the numbers, GM, controller, or the owner directly, fills one row and moves on. There isn't a step in this that requires an accountant.
The workbook is 13 weeks, one row per week, so a quarter builds itself as you go instead of arriving as a report someone assembles later. Two sample weeks are filled in already, with real formulas running, so you can see exactly how a row is supposed to look before you touch the first blank one.
What's actually in each row, and the math behind it
Every row carries net sales, food purchases, beverage purchases, and the week's inventory change, which together produce cost of goods sold. COGS isn't just what you bought this week. It's purchases adjusted for whether your stock grew or shrank: if the count shows inventory dropped, that draw-down gets added to COGS, because you used more than you bought. If inventory grew, you bought ahead of what you sold, and that buildup comes back out. Skip this step and COGS is really just a purchases number wearing a cost label.
Labor splits into hourly wages, salaried wages, and payroll taxes and benefits, which sum to total labor. Prime cost is COGS plus total labor. Every percentage on the sheet, prime cost %, COGS %, labor %, divides its dollar figure by net sales. There's a target cell you set once for your concept, and the prime cost % column turns red the moment a week runs over it, so the number that matters doesn't hide in a column of numbers that all look similar.
Where the targets come from
Restaurant365 puts full-service prime cost at 60 to 65% of sales and quick service at 55 to 60%. The gap is labor intensity. A QSR runs a leaner front of house and a simpler kitchen, so its target sits lower. WhippleWood CPAs, reading National Restaurant Association 2026 data, lands on a wider 55 to 65% band across concepts. The same WhippleWood page puts the food cost target at 28 to 35% and the current full-service average at 32.4%, and the full-service labor median at 36.5% of sales, with profitable operators holding labor closer to 34.2%. Those are somebody else's sample, published as a reference point, so use them as a sanity check rather than a verdict. The two-point labor gap between the median and the operators making money is about the size of one badly built schedule.
The same WhippleWood page cites the National Restaurant Association's State of the Industry count: 42% of U.S. restaurants were profitable across 2024 and 2025. Prime cost is the lever most of that other 58% never look at until it's too late to fix cheaply. If you want a live view of how a single menu or pricing change moves your margin day to day, the profit margin calculator is built for that; this tracker is built for the weekly discipline underneath it.
Why weekly beats monthly
A three-point drift in prime cost, caught in week two, is a schedule fix: cut four hours off Tuesday's prep shift, tighten the produce order, done by Friday. The same three-point drift, caught in month two because that's when the P&L finally closed, is a whole quarter of overspending you can't get back, plus a harder conversation about why nobody flagged it sooner. Weekly tracking doesn't find problems monthly tracking can't eventually find. It finds them while they're still cheap.
Reading it, not just filling it
The sheet tells you what moved; you still have to figure out why. COGS climbing while sales sit flat usually means one of three things: waste, theft, or a supplier price increase nobody adjusted the menu for. Pull the invoices from that week and check unit prices before you assume it's shrink. Labor climbing while sales fall is almost always a scheduling problem, someone built the week off last year's numbers instead of this month's trend, and the fix is the next schedule, not a lecture.
The flash report: the owner's whole weekly read
The companion flash report is one printable page: the week and location, sales against last year and budget, cost of goods with the COGS%, labor with the labor % and overtime hours, and prime cost against target. Below that sits a short section called Three Things: one win, one problem, one decision that needs an answer. A GM who can't fill those three lines honestly hasn't actually looked at their own week. Sign-off closes it, the GM's name and the owner's or controller's, so someone can point to proof the report was read, not just filed.
Mistakes that quietly wreck the number
Mixing accrual and cash inside the same row is the most common one: purchases logged on the invoice date but sales pulled on a cash basis a day off from it, which makes every percentage on the sheet slightly wrong in a way that's hard to spot. Skipping the inventory change is close behind, because purchases alone always look better than true usage, especially in a week where someone stocked up ahead of a holiday. Forgetting payroll taxes and benefits understates labor by 10 to 20%, which is enough to make a real prime cost problem look like a fine one. Comparing your number to a national chain's published benchmark instead of your own best week measures you against a kitchen, supplier base, and labor market that isn't yours; your best week already accounts for all of that. And pulling this together monthly instead of weekly turns a tool built to catch a drift early into one more historical record nobody acts on in time.
Running it across five, ten, fifty stores
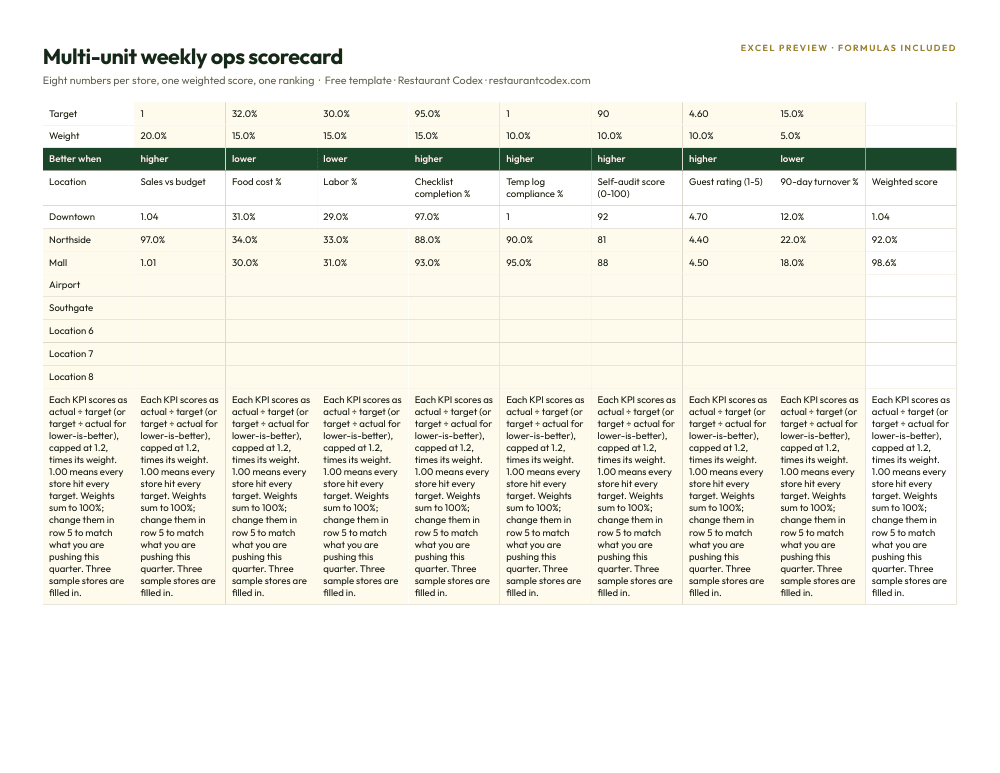
One tracker per location, filled out by that store's manager, using the same target cell across the group so every store is being measured against the same bar. Someone at HQ rolls the week's numbers into a single view that ranks every store by prime cost percentage, best to worst. The average across the portfolio tells you almost nothing useful; the spread between your best store and your worst one is where the real opportunity sits, because it proves the gap is operational, not structural. If store 4 runs eight points better than store 9 on the same menu and the same supplier pricing, store 9 doesn't have a market problem. It has a Tuesday-schedule problem. Pair this with the multi-unit weekly ops scorecard and a district manager can read prime cost and the rest of the operational picture from the same weekly stack.
How Restaurant Codex handles this
On paper, this tracker works exactly as described: fill it Monday, read the flash report, catch the drift in week two instead of month two. Restaurant Codex keeps the same weekly rhythm digital, pulling sales and labor straight from the POS and schedule instead of retyping them, and rolling every location's prime cost into one ranked view instead of an owner collecting 13 spreadsheets by email. Neither version replaces the other; the paper tracker is the whole discipline, on its own, for anyone who'd rather run it that way.
Restaurant Codex
The same checklist, on every phone, with photo proof
Restaurant Codex runs this template as a live task with timestamps, photos and one view across every location. Bring it to a 30-minute working session and we'll set it up on your real operation.
Prime cost and weekly P&L tracker
13 weeks, one row per week: sales, COGS, labor and prime cost against your own target · formulas included
Weekly flash report
One page: the week's sales, cost of goods, labor and prime cost, signed off by the GM · 7 sections
By the Restaurant Codex team
Written with operators who run multi-location restaurant groups. Reviewed against the FDA Food Code and the sources listed below.