What's in the workbook, and how it runs the count
A 3% variance in a kitchen that runs $12,000 of food a week is $360. Nobody notices $360. Over a year that's more than $18,000, and most restaurants never catch it, because the sheet they use for inventory stops at count times price and never asks what the number should have been. This download is two pieces. The workbook has item, category, storage area, count unit, par, beginning count, purchases, ending count, actual usage, unit cost, usage in dollars, theoretical usage pulled from POS sales, and variance in units, dollars and percent, with five sample rows already filled in so you can see the math before you touch it. Any row over 3% variance turns red on its own; nobody has to remember to look for it.
The blank count sheet is the field tool. Whoever's counting prints it, walks a fixed route through the walk-in, reach-ins, dry storage and the bar, and writes down what's actually there: item, unit, par, count, unit cost, extended dollars, and a notes column for anything odd, a case that's clearly short or a label that doesn't match the bin. That sheet gets keyed into the workbook the same day, while the count's still fresh enough that a weird number can get double-checked instead of just entered.
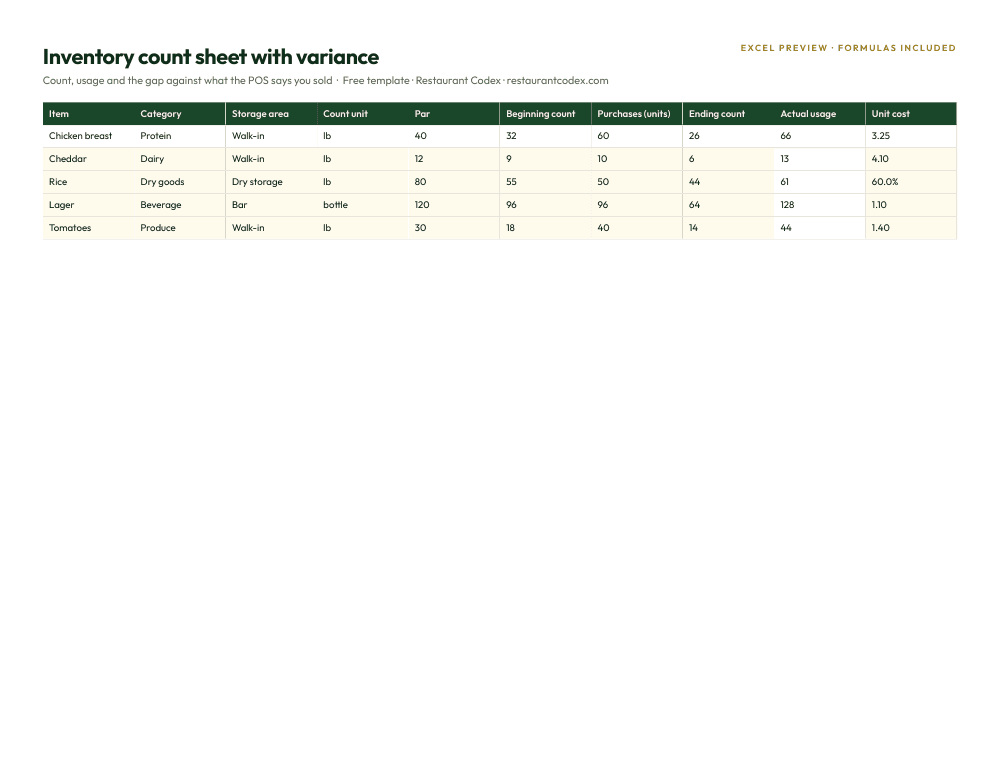
Inventory count and variance workbook
Beginning, purchases and ending counts roll into actual usage against POS theoretical usage, with variance in units, $ and %, red above 3% · formulas included
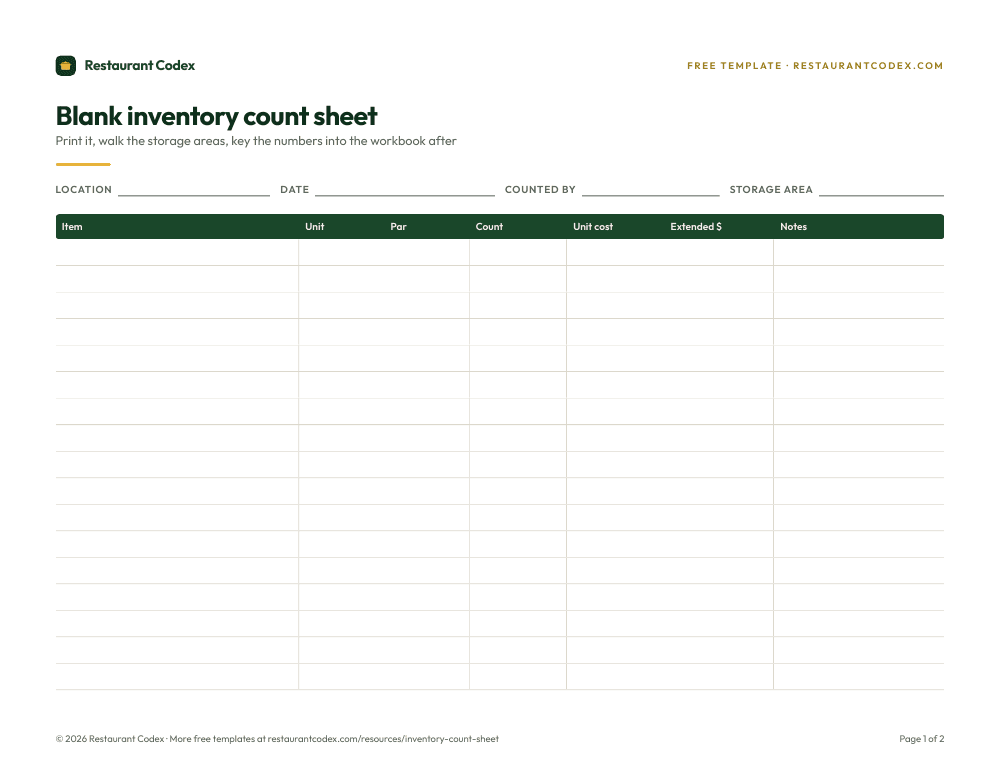
Blank inventory count sheet
Print it, walk the storage areas, key the numbers into the workbook after · 7 columns
Actual usage is arithmetic. Theoretical usage is the number that matters.
Actual usage is beginning count plus purchases minus ending count. That's it, no judgment involved, just what physically moved through the building this week. Multiply it by unit cost and you get usage in dollars, which tells you what you spent, but not whether you should have spent it.
Theoretical usage comes from a different place entirely: your recipes and your POS. If a burger uses 6 oz of ground beef and the POS says you sold 400 burgers this week, theoretical beef usage is 150 pounds, full stop, whether the kitchen actually used 150 pounds or something else. Put the two numbers next to each other and the gap between them, the variance, is the only line in the whole sheet that answers a real question: did what left the building match what the register says should have left it.
What counts as normal, and where that number comes from
Nobody publishes an official variance target the way the FDA publishes a holding temperature. What you get instead is a range that shows up across several inventory and pour-cost calculators: food overall sitting around 1% to 3% in normal operation, and liquor given more room, 3% to 5%, because an uneven pour and spill add up behind even a well-run bar. Say that plainly for what it is: vendor consensus, not a government number, gathered from the same calculators and blogs that sell inventory software. Treat it as a starting line, not gospel, and build your own trend once you've got eight or ten weeks of counts behind you. Your own history, for your own menu and your own bar program, will tell you more than someone else's published range ever will.
That's also why the workbook turns a row red at 3% instead of some tighter number. It's a flag to go look, not a verdict that someone stole a case of chicken thighs.
A red row is a question, not a verdict
Work down the list in the order you're actually likely to find the answer, not the order that makes the best story. Start with portioning: a line cook free-pouring instead of using the jigger, a heavier scoop than the recipe card calls for, will move a variance number every single week without anyone touching the walk-in door with bad intent. Waste comes next, and it's the gap between what actually got trimmed, dropped or spoiled and what got written down on a waste log; unlogged waste looks exactly like theft on paper because there's no record explaining where the product went. Theft is real, but it's further down the list than most owners assume, and a variance number alone won't tell you which of the first two problems you actually have versus this one. After that: a recipe card that doesn't match what's actually going into the dish anymore, someone added a garnish six months ago and the card never caught up. Last, check the count itself. A unit mismatch, cases counted as eaches, or a transposed number on the sheet will produce a variance that has nothing to do with the kitchen at all.
Weekly counts, monthly counts, and the twenty items that carry the store
Count everything weekly, same day, same time, before the first delivery hits the dock, so nothing you're about to receive gets mixed into last week's number. A full monthly count reconciles categories you don't touch as often, paper goods, backup smallwares, bar garnishes, where a weekly cadence is more discipline than the dollar value justifies.
Your top 20 items by dollar spend, almost always proteins, seafood and top-shelf liquor, deserve more attention than everything else on the sheet combined. Pull that list straight out of your recipe and menu costs: the ingredients with the highest extended cost per week are the ones where a 1% miss is real money and a theft or portioning problem hides the longest. Count those twice a week if you can, or move them onto a running perpetual balance instead of waiting for the weekly walk.
Mistakes that make the variance column lie
Counting after the delivery truck's already unloaded. Whatever just came in gets tangled into the ending count, and the week's actual usage number is now wrong in a way that looks exactly like a variance problem.
Eyeballing a case into a weight instead of actually weighing or counting it. "About half a case" turns into a number on the sheet that nobody can defend a week later when someone asks where it came from.
Changing units between counts. Counting chicken breasts in cases one week and pounds the next breaks the whole trend line; the sheet can't tell the difference between a real usage change and a unit you swapped without thinking about it.
No unit cost on the sheet, just a count. A count without a price attached can't turn into a dollar variance, which means the one number an owner actually cares about never gets calculated at all.
Spending twenty minutes arguing about a half-percent variance on dried parsley while a 4% swing on beef sits one row down, unexamined. Sort by dollar impact before you sort by anything else.
Running counts across more than one location
Every store counts the same item list, in the same units, on the same day of the week, so a district manager can put four locations side by side and actually compare them instead of translating between four homemade formats first. Variance by store, not the raw dollar total, is the first screen: a 300-seat flagship will always show a bigger dollar variance than a 60-seat satellite even when it's running tighter, so read the percentage before the number gets someone in trouble for the wrong reason. Log every transfer between stores, a case of beef that moved from location 3 to cover a delivery miss at location 7, on both sheets, or it shows up as a mystery loss at one store and a mystery gain at the other, and both numbers are wrong for a reason that had nothing to do with either kitchen.
How Restaurant Codex handles this
In Restaurant Codex, whoever's counting enters numbers from a phone while they're standing in the walk-in, the app pulls theoretical usage straight from POS sales instead of someone retyping last week's export, and the variance math runs itself the moment the count closes. An owner watching six locations sees which store is trending 4% high on protein before anyone has to build a spreadsheet to find out.
Restaurant Codex
The same checklist, on every phone, with photo proof
Restaurant Codex runs this template as a live task with timestamps, photos and one view across every location. Bring it to a 30-minute working session and we'll set it up on your real operation.
Inventory count and variance workbook
Beginning, purchases and ending counts roll into actual usage against POS theoretical usage, with variance in units, $ and %, red above 3% · formulas included
Blank inventory count sheet
Print it, walk the storage areas, key the numbers into the workbook after · 7 columns
By the Restaurant Codex team
Written with operators who run multi-location restaurant groups. Reviewed against the FDA Food Code and the sources listed below.