What's in the download and how it runs on a shift
Chicken goes from $3.10 a pound to $3.80 on one invoice, and the grilled chicken plate that ran 28.6% food cost is now running 31.1%. Nobody notices until the P&L lands a month later. This download is two things: an Excel workbook that costs every recipe on your menu, and a one-page worksheet for costing a new dish by hand before it's typed into a spreadsheet.
The workbook has two sheets. An Ingredients sheet holds one row per ingredient: purchase unit, purchase price, recipe units per purchase unit, and a yield percentage, and computes a cost per recipe unit for you. A Recipe sheet looks up those costs, sums the lines for a dish, divides by portions, and shows food cost % against the menu price you type in, along with the price to hit a target and the gross profit per plate. The food cost % cell turns red once a dish goes over target.
The kitchen manager or chef owns this, not the bookkeeper. A new dish gets costed on the worksheet at the test-kitchen stage, and the numbers move into the workbook once confirmed. From there it lives on a shared drive or a binder by the walk-in, and whoever pulls a new invoice updates the Ingredients sheet that same week.
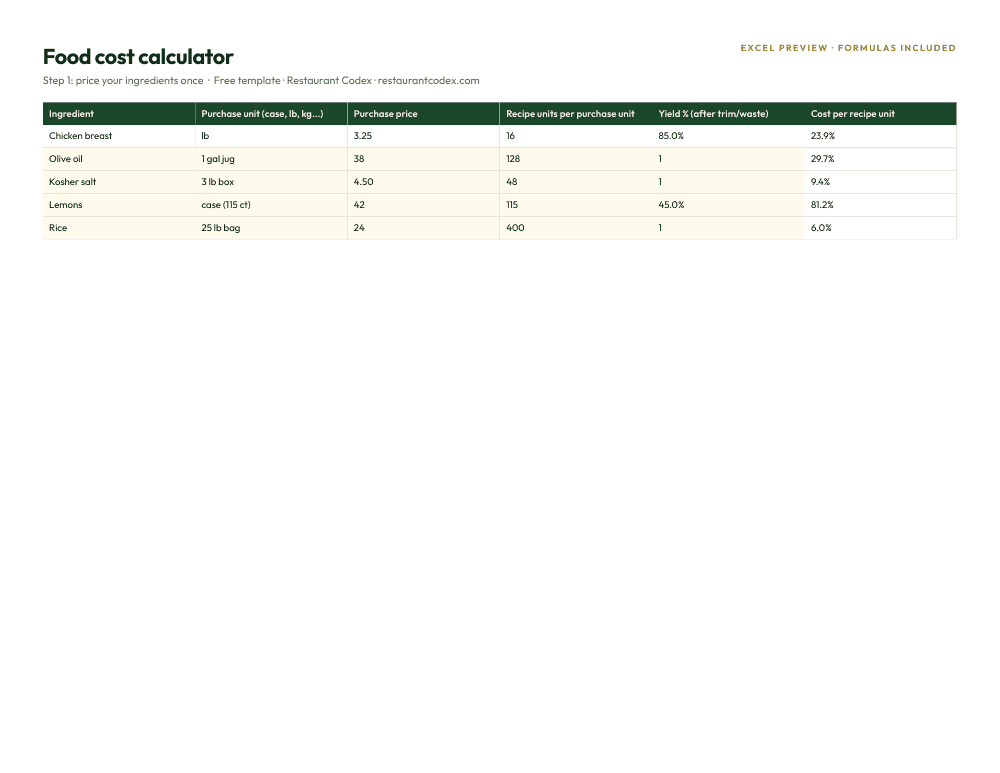
Food cost calculator
Ingredient costs, yield, and portion size roll up to a food cost % per dish and the price to hit target · formulas included
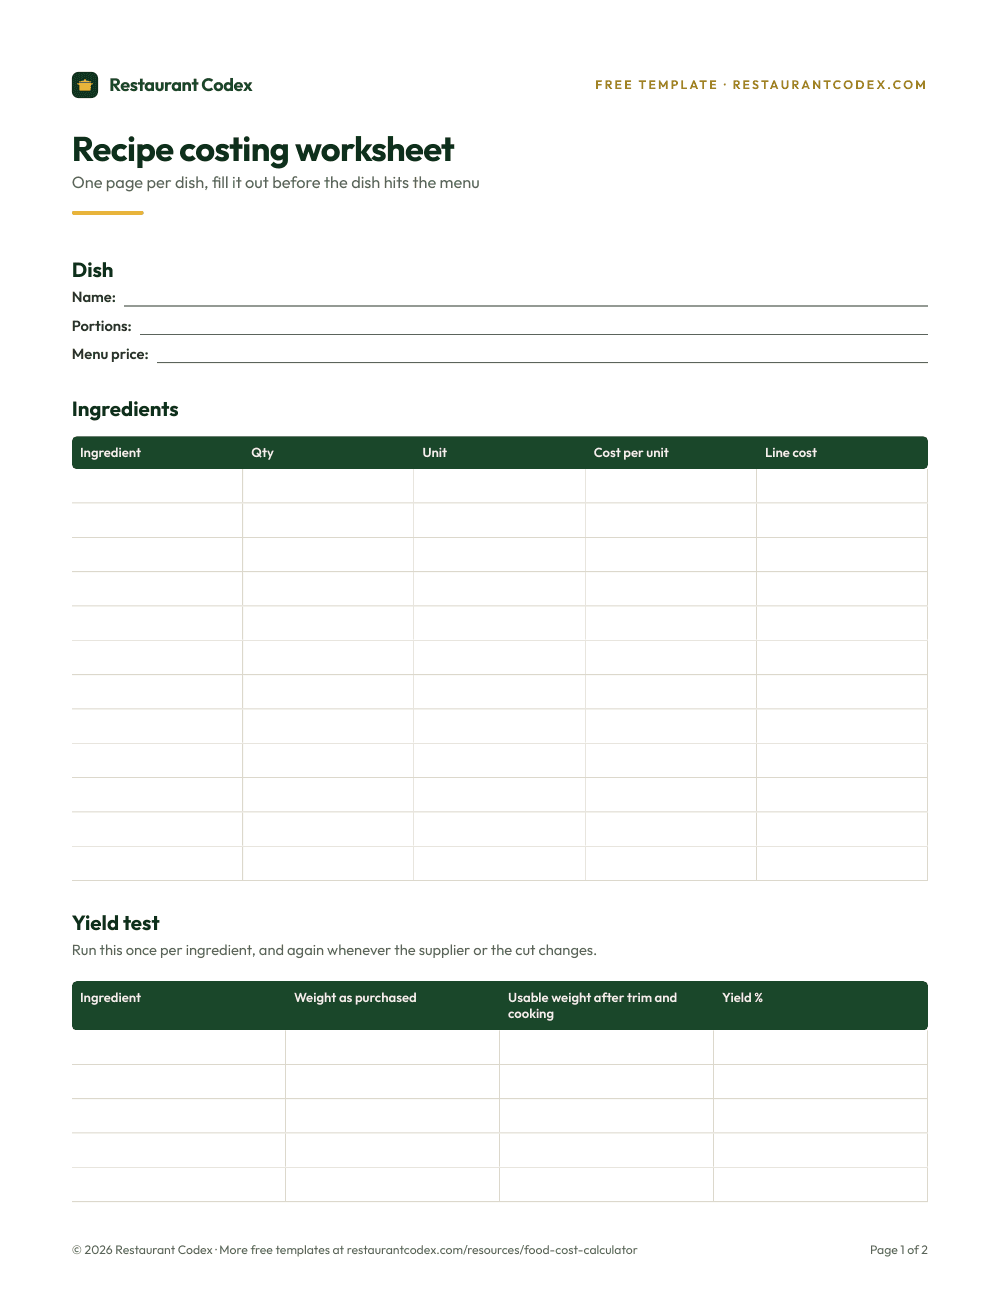
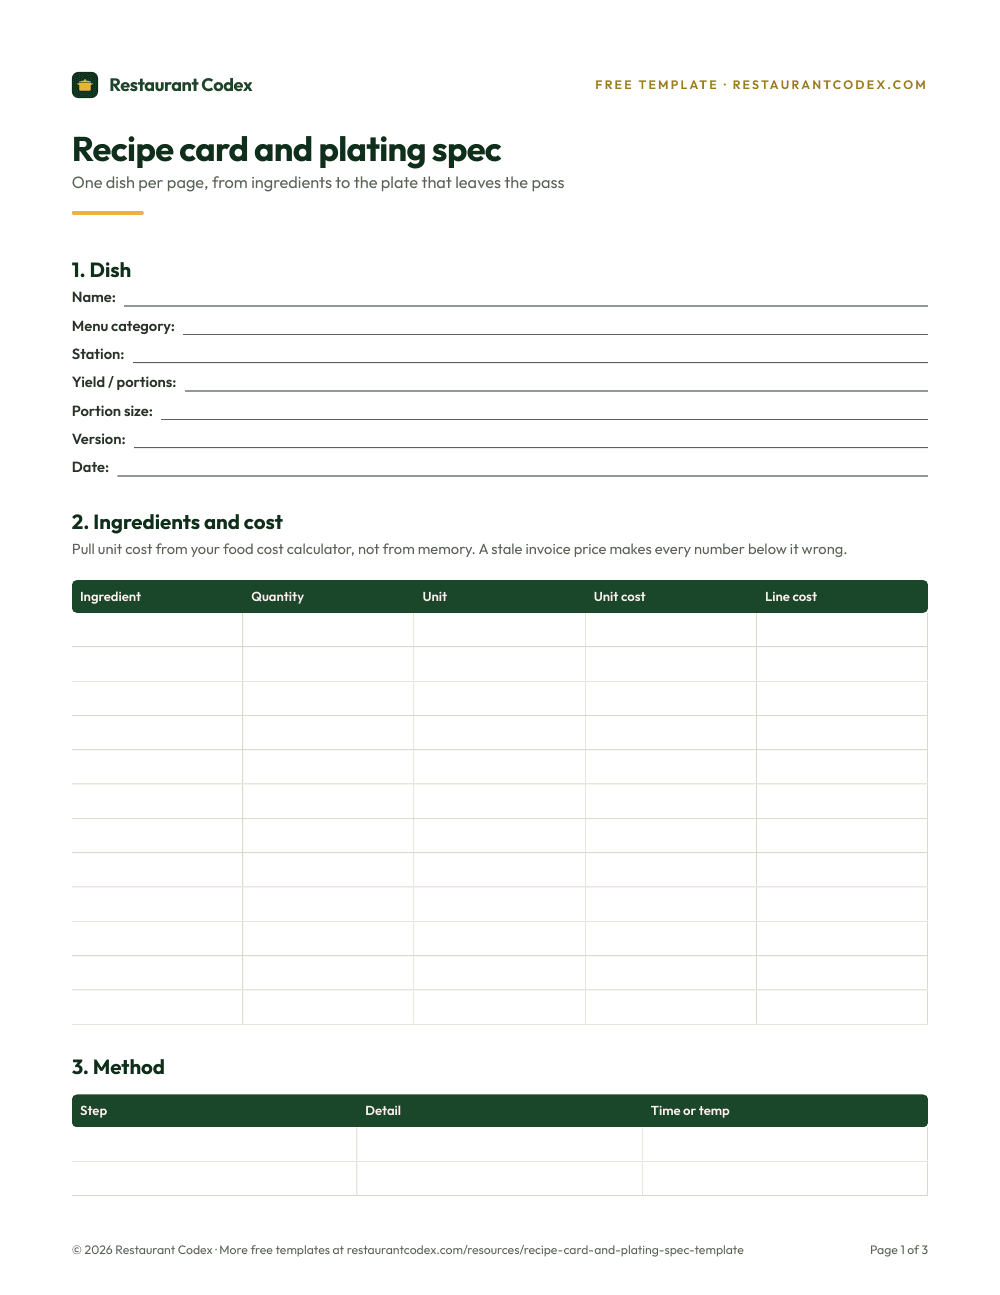
Recipe costing worksheet
One page per dish, fill it out before the dish hits the menu · 6 sections
The formulas, and a plate that proves them
Every dish runs through the same five steps: cost per recipe unit equals purchase price divided by units per purchase unit, divided by yield. Recipe cost is the sum of every ingredient line, quantity used times cost per recipe unit. Cost per portion is recipe cost divided by portions. Food cost % is cost per portion divided by menu price. And the price to hit a target is cost per portion divided by the target food cost %.
Here's a plate that proves it: grilled lemon chicken, one portion, priced at $17.
Take the chicken. You pay $3.10 a pound, 16 ounces, but not all 16 make the plate: trim and the weight lost in the pan bring usable yield to about 85%. Cost per recipe ounce is $3.10 divided by 16, divided by 0.85, or about $0.23. Put 8 ounces on the plate and that line costs $1.82, not the $1.55 you'd get by skipping yield and dividing the purchase price straight across.
| Ingredient | Qty used | Line cost |
|---|---|---|
| Chicken breast, boneless skin-on | 8 oz | $1.82 |
| Yukon potatoes | 6 oz | $0.38 |
| Broccolini | 4 oz | $0.88 |
| Butter | 2 oz | $0.50 |
| Lemon, juice and zest | 0.5 usable lemon | $0.67 |
| Garlic | 3 cloves | $0.29 |
| Olive oil | 1 tbsp | $0.13 |
| Salt, pepper, herbs | flat rate | $0.20 |
Add the eight lines and the recipe costs $4.87, which is also cost per portion since this dish makes one. Against the $17 menu price, food cost % is $4.87 divided by $17, or 28.6%. At a 30% target, the price that hits it exactly is $4.87 divided by 0.30, or $16.23, so $17 already clears target, and gross profit per plate is $17.00 minus $4.87, or $12.13. That last number, not the percentage, is what lands in the drawer.
Yield: why 85% chicken and 45% lemons change everything
Yield is the gap between what you buy and what makes it onto the plate. A case of chicken loses weight to trim, bone, and moisture in the pan. Whole produce loses more: peel, core, stem, the parts of a lemon that never touch the sauce. Skip the yield step and every cost on the sheet reads too low.
The 85% on chicken above isn't universal, it's what one kitchen measured on one case from one supplier. Run your own cutting test: weigh the case as it arrives, weigh what's trimmed and cooked off, and the difference is your yield. Do it again if the supplier or the cut changes. Lemons at 45% usable are the more dramatic version of the same math: most of what you pay for by weight is peel and pith you throw away, so a $0.60 lemon costs more than double that once you count only what's usable. The recipe card and plating spec is where that trimmed weight gets written down once.
What "on target" looks like
Full-service food cost in the US averaged 32.4% in 2026, per National Restaurant Association data cited in WhippleWood's restaurant financial benchmarks. The working range most operators use is 28% to 35%, wider for concepts with big protein swings, narrower for a tight, produce-forward menu. Below 28% often means stingy portions; above 35% and the money's leaking somewhere: oil, waste, over-portioning, a supplier hike nobody re-costed for.
Add labor cost % to food cost % and you get prime cost, the number that says whether the restaurant can make money at its volume. Restaurant365 puts the full-service target at 60% to 65% of revenue, 55% to 60% for quick service. This calculator doesn't compute prime cost, that's the prime cost tracker's job, but the food cost % it produces is one of the two inputs.
Food cost % isn't the same as profit
A 40% food cost dish can be the best earner on the menu, and a 22% dish can be a problem. A ribeye that costs $9.60 and sells for $24 runs 40% food cost and $14.40 profit on the plate. A side salad at $0.90 that sells for $6 is a tidy-looking 15% food cost, but it puts only $5.10 in the drawer. Sell forty of each and the ribeye did nearly three times the profit work at nearly three times the food cost percentage. Chasing a low percentage on every line is how kitchens end up shrinking the portions people actually order.
What matters is dollar profit per plate, weighted by how often it sells, which is what a menu engineering matrix sorts for you once you've got sales-mix data out of the POS. The whole-restaurant version runs through the profit margin calculator: recipe costs roll up to a menu-wide number, one input into whether the restaurant is profitable.
When to re-cost a recipe
Re-cost the moment a purchase price moves on an invoice, at least for anything that's a big share of the plate. Beyond that, run every recipe through the sheet at least once a quarter, on a set schedule, not whenever someone notices the number looks off. Prices creep between invoices, cheese, oil, and produce especially, and a menu priced right in January can be two or three points off by summer.
Mistakes we keep seeing
Costing off the invoice price instead of the yield-adjusted one. This is the single biggest source of a cost sheet that's wrong by five or six points.
Forgetting the garnish and the oil in the pan. A cost sheet built around the protein and starch looks tight until you add the oil for every sear and the herb pinch on every plate. None of it is huge alone; together it's a point or two that never made the sheet.
Using last year's prices because nobody's updated them. A cost sheet built in January and never touched again isn't tracking your food cost. It's tracking January's.
Pricing by food cost % alone, chasing a number instead of a dollar. A low percentage doesn't mean a dish is doing the restaurant any favors, and a high one doesn't mean it's a loser.
Never costing the specials. The dish built on the fly out of the walk-in is the one most likely to bleed money, because it never runs through the sheet at all.
Running this across more than one location
HQ owns one ingredient master, one price and one yield per ingredient, that every location's recipes pull from, so a chicken breast costs the same $3.10 on paper in every store even if the truck delivering it is different. What HQ can't standardize is the invoice: a store in one market pays a different distributor a different price for the same cut, sometimes 10% more, and that gap is real, not a data-entry error. The useful move is comparing the same plate's actual cost store by store. If location four pays noticeably more than location one, that's a supplier conversation worth having, or a sign the case off that truck isn't the spec you costed.
How Restaurant Codex handles this
Restaurant Codex keeps one ingredient list for the whole group, so a price update from one store's invoice flags every recipe that uses it, instead of sitting unnoticed in a spreadsheet nobody reopened. Food cost % shows up next to the target for every dish, by location, so a district manager sees which store's chicken plate drifted before the monthly P&L says so.
Restaurant Codex
The same checklist, on every phone, with photo proof
Restaurant Codex runs this template as a live task with timestamps, photos and one view across every location. Bring it to a 30-minute working session and we'll set it up on your real operation.
Food cost calculator
Ingredient costs, yield, and portion size roll up to a food cost % per dish and the price to hit target · formulas included
Recipe costing worksheet
One page per dish, fill it out before the dish hits the menu · 6 sections
By the Restaurant Codex team
Written with operators who run multi-location restaurant groups. Reviewed against the FDA Food Code and the sources listed below.