The gap the average hides
A five-store group's monthly food cost prints at 31%, comfortably inside the 28% to 35% range the National Restaurant Association calls healthy. Nobody at headquarters looks twice. They should: store 2 is running 27%, store 4 is running 36%, and blending the two gives you a number that describes no actual store while hiding the one that's in trouble.
That's how multi-unit groups fail: not one bad month everyone sees coming, but a slow drift at one or two stores that the average quietly absorbs, until it surfaces somewhere expensive, a failed inspection, a GM who quits and takes "how store 4 really runs" with them. A weekly scorecard puts the spread between stores in front of you every Monday, not just the blend.
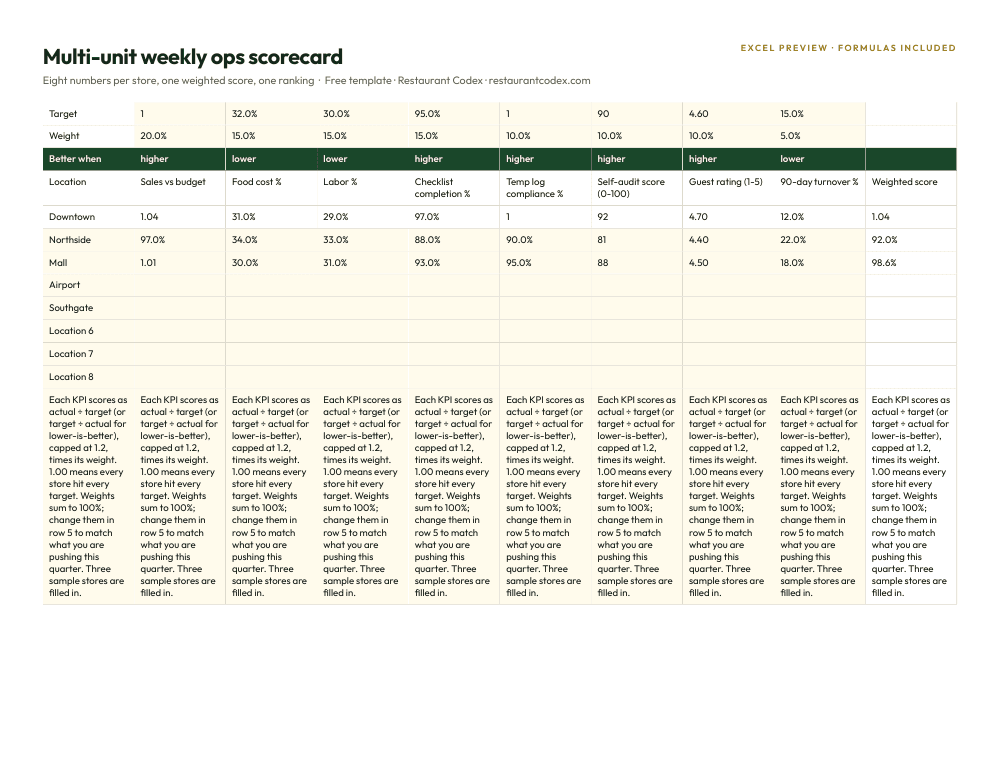
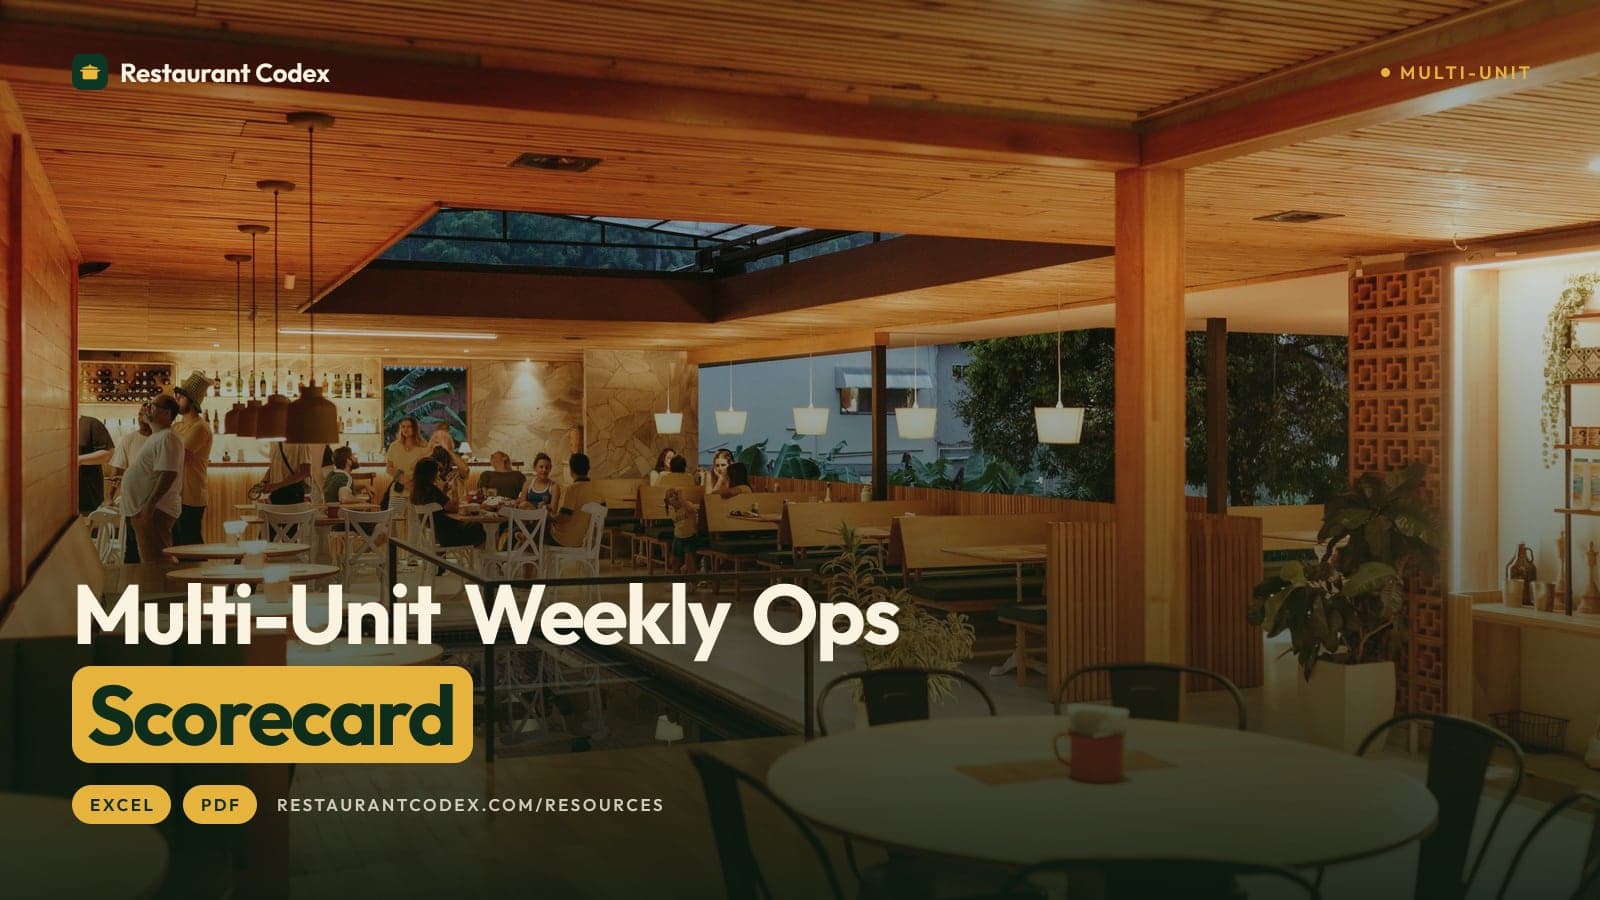
Multi-unit weekly ops scorecard
Up to 8 locations, 8 weighted KPIs, ranked automatically every week · formulas included
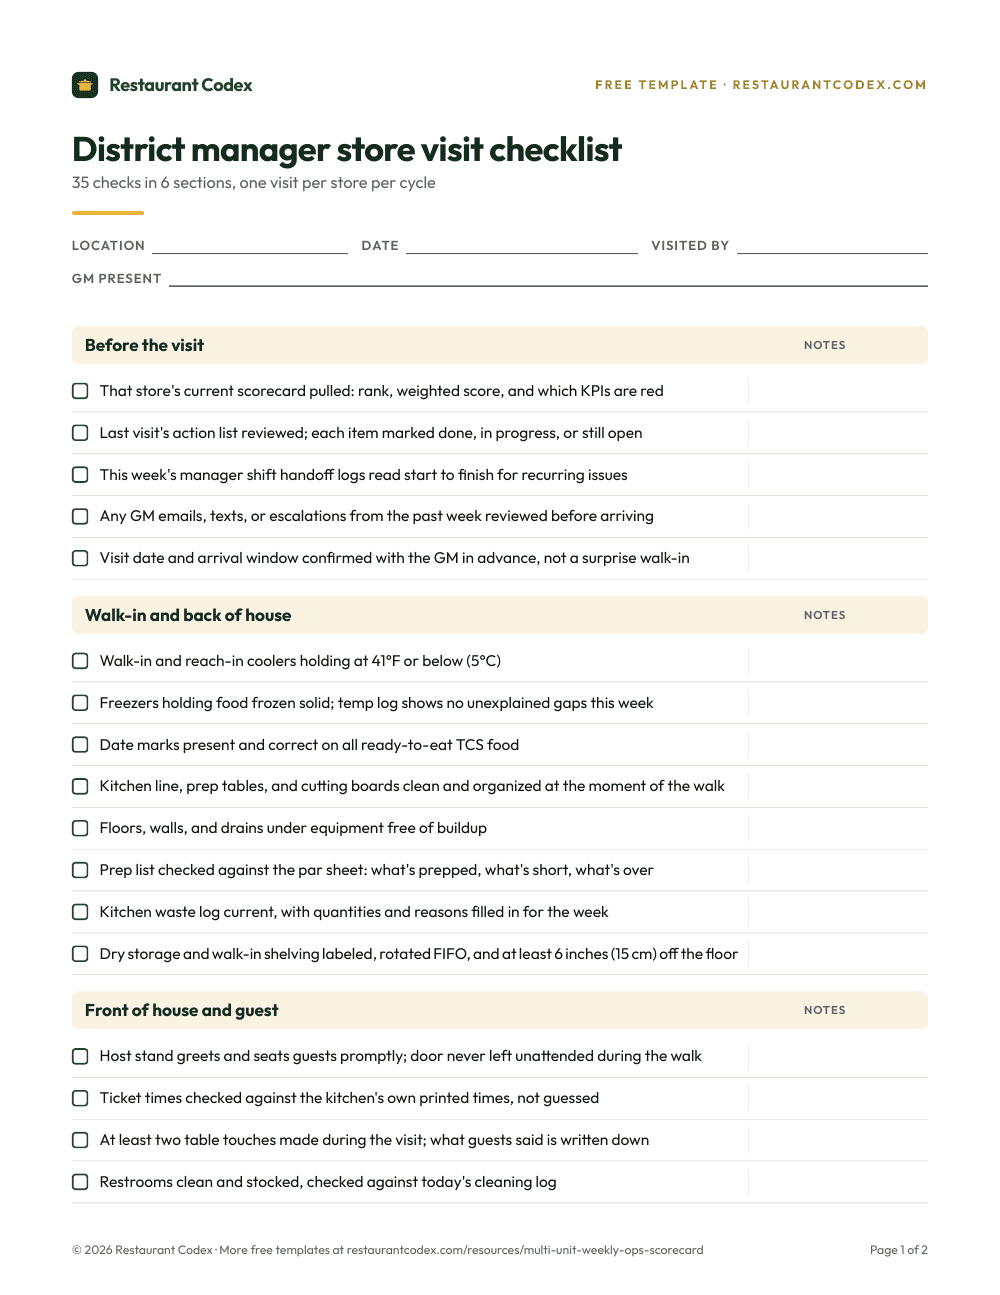
District manager store visit checklist
35 checks in 6 sections, one visit per store per cycle · 35 items
What's in the download, and who touches it
Two files do this job. The scorecard is a workbook: eight KPIs across the top, up to eight locations down the side, with an editable target and weight in the two rows above the store list. Whoever runs weekly ops loads last week's actuals every Monday morning, before the meeting, and the sheet does the math: a weighted score per store, a rank, a red row the moment a store drops under 0.95.
The visit checklist is the other file, used by someone else: the district manager, inside the store, once a cycle. Six sections walk the building and the numbers with the GM. After, every action gets an owner and a date before the DM leaves the lot.

The eight numbers, and why these eight
Two are money: sales against budget, and food cost percentage, the two a P&L already shows. They stay here because a scorecard that skips the money is a compliance form in a business costume.
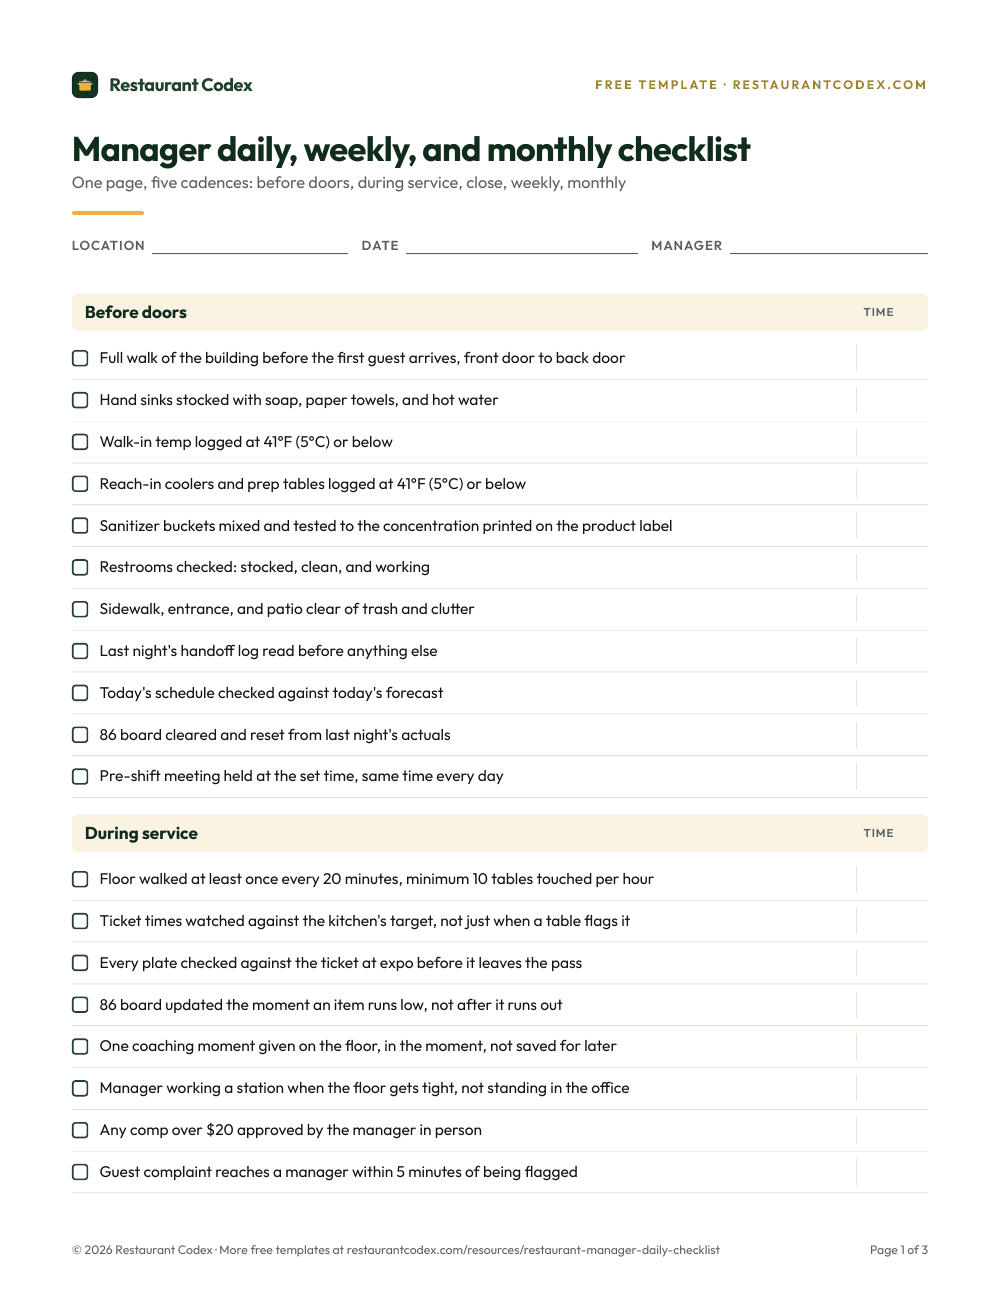
Two are execution: labor percentage and checklist completion. Labor isn't really a money question here, it's discipline: did the store build its schedule to the forecast and run it, or wing it and eat the overtime. Checklist completion, pulled from the manager's daily checklist, just asks whether the basics got done every shift, not just the ones someone remembered to mention.
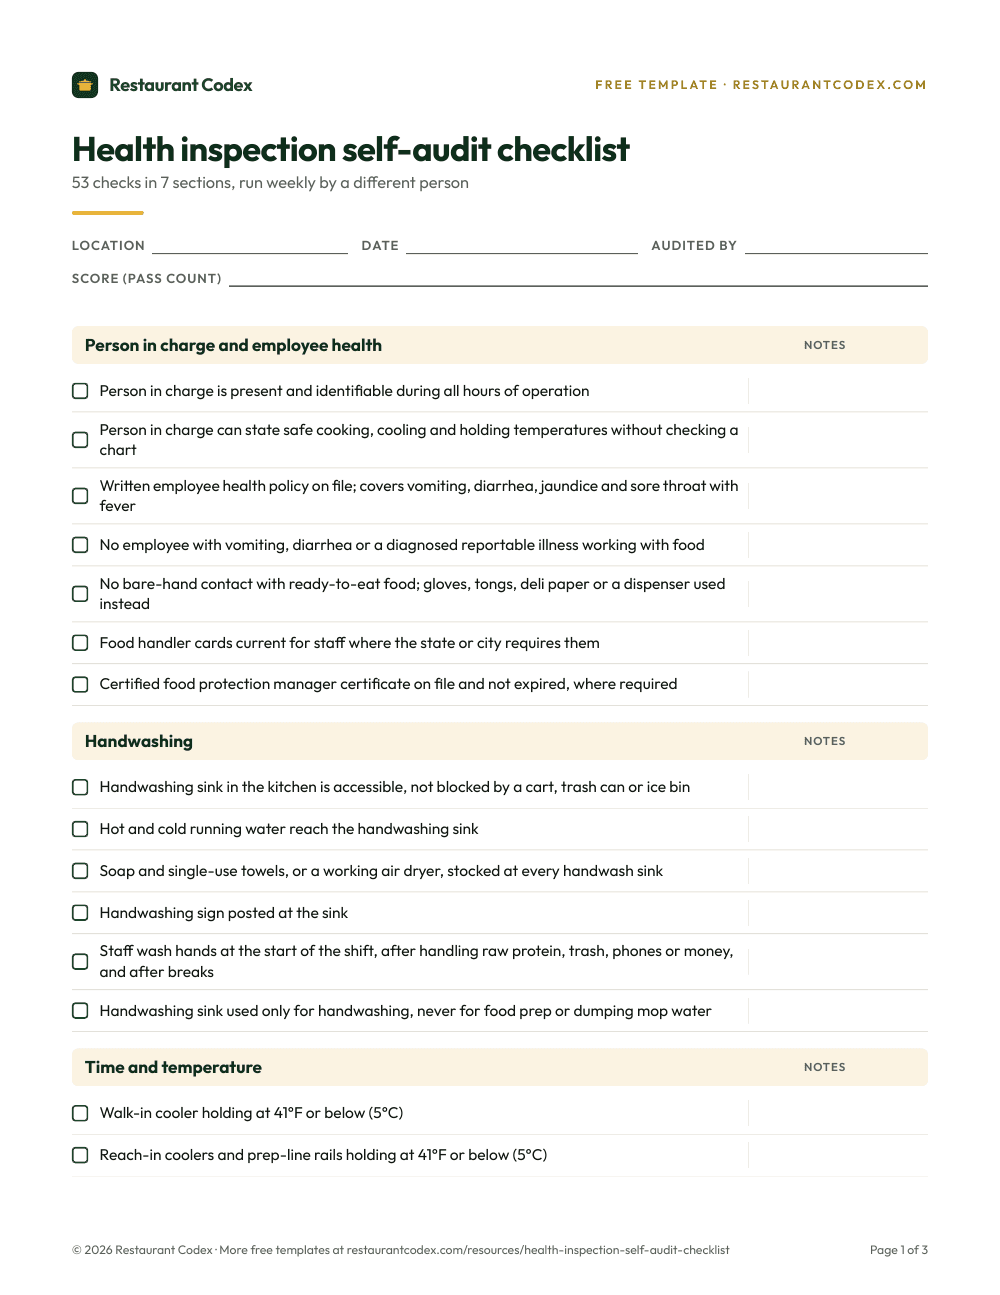
Two are safety: temp log compliance and self-audit score, drawn from the health inspection self-audit checklist. Cold holding at 41°F or below, hot holding at 135°F or above, per the FDA Food Code. This is the pair that can close a store, which is why it stays on the sheet in a quiet week.
Two are people: guest rating and 90-day new-hire turnover. A store can hit every cost target by running short-staffed and cutting corners a guest can feel; guest rating catches what a P&L won't. Turnover at 90 days catches the other lever: staying profitable by burning through hires nobody trains.
Eight is deliberately not ten or twelve. Every number here is something a GM can move this week; a ninth nobody can influence just teaches the team to shrug at a red cell.
How the weighting works, and when to change it
Each KPI scores as actual divided by target, or target divided by actual where lower is better, which covers food cost, labor and 90-day turnover. Each one is capped at 1.2, so a monster sales week can't bury a failed temp log. Multiply by the weight, add the eight, and that's the store's score. The weights aren't even out of the box: sales against budget carries 20%, food cost, labor and checklist completion 15% each, temp logs, self-audit and guest rating 10% each, 90-day turnover 5%. They add to 100%, so a store that hits every target lands on 1.00 and a store that beats them lands above it. Miss a heavily weighted target and the score drops faster than missing a light one by the same margin. That's the point of a weight.
Change the weights in row 5 once a quarter, for the whole group at once, never for one store alone. If this quarter's real risk is a run of health department visits, raise the weight on temp log compliance and self-audit score, then reset it next quarter. What you can't do is let one store's weights drift from the rest: the moment weights differ store to store, the rank stops meaning anything.
The Monday review, in 30 minutes, across every store
Pull the ranked list and look at three things. First, the rank: who moved up or down, and by how much. Second, the spread: the gap between your top store's score and your bottom store's. A tightening spread means the group is converging on a standard; a widening one means someone's about to have a bad month nobody flagged in time. Third, for each red store, assign exactly one action, with an owner and a date, before the meeting ends. Not three. One. A red store handed five fixes gets none of them done; handed one, it gets done by Thursday.
At eight stores that's two or three minutes each and ten minutes of discussion. The scorecard did the sorting before anyone sat down.
The visit is the scorecard's other half
The scorecard tells you where to look. It doesn't tell you why. A self-audit score can be a real 92 or a rushed 92 where the person filling it out is the one it's supposed to catch. A food cost miss can be theft, waste, a vendor increase the budget hasn't caught up to, or a portioning problem nobody's clocked, and the percentage alone can't tell those apart.
That's what the visit checklist separates. Before the visit, the DM reads that store's scorecard, last time's open actions, and the week's handoff logs, so the walk starts already knowing where to look. It covers the back of house (temps, date marking, the prep list against pars, the waste log), the front of house (ticket times, table touches, restrooms, curb appeal), and people (schedule against forecast, each new hire's 30-60-90 plan), a checkbox and a notes line each, not one pass or fail for the whole store. Then the DM walks the prime cost line by line with the GM and leaves with a follow-up list carrying an owner, a date, and the next visit booked, tying into the prime cost and weekly P&L tracker.
What headquarters standardizes, and what the GM owns
HQ owns the definitions: what counts as sales, how food cost is calculated, which eight KPIs are on the sheet, this quarter's targets and weights, the six sections of the visit checklist. None of that varies by store, because the moment it does, store 4's 0.97 and store 7's 0.97 stop meaning the same thing.
The GM owns everything under the number: how the schedule gets built to hit the labor target, which vendor gets the call when food cost drifts, what the corrective action is when a temp log flags a cooler. HQ should never write a GM's fix for them. HQ names the target and the weight; the plan belongs to the GM. A GM who has to ask headquarters how to run their own kitchen is being operated by remote control.
Where this breaks
Five mistakes show up constantly. The first is a scorecard that grows to ten or twelve KPIs because someone keeps adding "just one more thing worth tracking." A GM who can't move most of their own numbers stops treating any of them as real.
The second is weights nobody revisits, set once at launch and left alone for two years while the business's real risk (a tight labor market, a run of bad health scores) has moved on entirely. Put a quarterly weight review on the calendar the same day you build the sheet.
The third, and most common, is punishing the bottom store instead of studying the top one. Last place already knows it's last place. What groups rarely do is sit the top-ranked GM down, ask what they're doing differently, and hand that answer to the other seven. The spread is a comparison tool before it's a scoreboard.
The fourth is a scorecard with no visit behind it. Numbers alone get gamed, not always on purpose: a self-audit score creeps up because whoever fills it out learns which boxes get checked without really looking. A number nobody ever walks and verifies in person ends up measuring the paperwork, not the store.
The fifth is the mirror problem: visits with no scorecard prepping them. A DM who shows up cold finds whatever's easiest to see that day and misses the pattern that only shows up across four weeks of data. The scorecard and the visit are one system; running either alone is running half of it.
How Restaurant Codex handles this
Restaurant Codex runs the same eight KPIs and visit sections digitally: the scorecard updates itself from checklists and logs your stores already fill out, the rank and the spread stay live instead of a Monday snapshot, and a DM's visit notes land against that store's history instead of a loose page in a binder. None of that is required. Built and run honestly, the spreadsheet and the paper checklist do the same job.
Restaurant Codex
The same checklist, on every phone, with photo proof
Restaurant Codex runs this template as a live task with timestamps, photos and one view across every location. Bring it to a 30-minute working session and we'll set it up on your real operation.
Multi-unit weekly ops scorecard
Up to 8 locations, 8 weighted KPIs, ranked automatically every week · formulas included
District manager store visit checklist
35 checks in 6 sections, one visit per store per cycle · 35 items
By the Restaurant Codex team
Written with operators who run multi-location restaurant groups. Reviewed against the FDA Food Code and the sources listed below.