What is menu engineering?
Menu engineering is a way to decide which dishes to promote, reprice or drop by comparing how often each dish sells with how many dollars it contributes to profit. Michael Kasavana and Donald Smith developed it at the Michigan State University School of Hospitality Business around 1982, according to Kasavana's AHLEI article series.
It exists because food cost percentage misleads. Kasavana writes that "perhaps the oldest misconception in food service management is that food cost is directly related to profitability." He adds that the highest-gross-profit items usually carry higher food cost percentages, and that promoting only the low-percentage dishes often lowers the average check.
Each dish needs three numbers: plates sold, menu mix (its share of all plates sold) and contribution margin (what's left of the price after the dish's direct cost). Everything below is arithmetic on those three columns, plus a decision about what to do next.
How do you classify dishes as stars, plowhorses, puzzles and dogs?
You classify each dish twice, once on popularity and once on contribution margin, and the two answers put it in one of four boxes. Stars are high on both. Plowhorses are popular but low on margin. Puzzles earn a high margin but sell little. Dogs are low on both (AHLEI, Part Two).
Two rules draw the lines. A dish is popular if its menu mix is at least 70% of an equal share, which is 1 ÷ N × 70% for a menu of N dishes. A dish is high-margin if its contribution margin is at or above the menu's average, which is total contribution margin divided by total plates sold.
Here's a hypothetical restaurant that sold 920 entrées last week across eight dishes. The numbers are invented, the method is Kasavana's.
| Dish | Price | Food cost | Margin | Food cost % | Plates | Mix | Total margin | Class |
|---|---|---|---|---|---|---|---|---|
| Cheeseburger | $15.00 | $4.20 | $10.80 | 28.0% | 220 | 23.9% | $2,376 | Plowhorse |
| Chicken sandwich | $14.00 | $3.80 | $10.20 | 27.1% | 180 | 19.6% | $1,836 | Plowhorse |
| 12 oz ribeye | $36.00 | $14.40 | $21.60 | 40.0% | 70 | 7.6% | $1,512 | Puzzle |
| Salmon plate | $28.00 | $9.80 | $18.20 | 35.0% | 110 | 12.0% | $2,002 | Star |
| Pasta primavera | $17.00 | $3.90 | $13.10 | 22.9% | 150 | 16.3% | $1,965 | Plowhorse |
| Pork chop | $26.00 | $8.30 | $17.70 | 31.9% | 90 | 9.8% | $1,593 | Star |
| Veggie bowl | $16.00 | $5.60 | $10.40 | 35.0% | 40 | 4.3% | $416 | Dog |
| Fish tacos | $18.00 | $5.00 | $13.00 | 27.8% | 60 | 6.5% | $780 | Dog |
The popularity line is 1 ÷ 8 × 70% = 8.75%, or 80.5 plates out of 920. The profit line is $12,480 of total margin ÷ 920 plates = $13.57.
Read the table with those two lines in hand. The cheeseburger sells the most, 23.9% of plates, but its $10.80 margin sits under $13.57, so it's a plowhorse. The ribeye leaves $21.60 a plate, the most on the menu, but 70 plates is under 80.5, so it's a puzzle. Pasta primavera has the lowest food cost percentage on the menu at 22.9%, and it's still below the average margin at $13.10. The ribeye has the highest percentage at 40.0% and the most dollars.
How do you calculate contribution margin per dish?
Contribution margin per dish is the menu price minus what the dish costs to put on the plate. Kasavana's article defines it exactly that way, and the whole method depends on getting the cost half right.
For the cheeseburger, $15.00 price minus $4.20 direct cost is $10.80. The food cost percentage is $4.20 ÷ $15.00 = 28.0%. Kasavana's own example makes the difference between the two measures plain: chicken bites at $3.00 with a $1.00 cost are a 33% item and leave $2.00. A NY strip at $5.00 with a $2.50 cost is a 50% item and leaves $2.50. The strip has the worse percentage and puts more money in the till.
Kasavana says item cost should include the food (counting wasted product and product loss), incremental labor for in-house prep and plating, condiments, and packaging where there is any. For most kitchens that means the ingredients, the sides and garnish that come with the plate, and the takeout box on those orders. If your recipe costs are rough, fix that first, because every margin below inherits the error. How to cost a recipe to the gram covers it step by step.
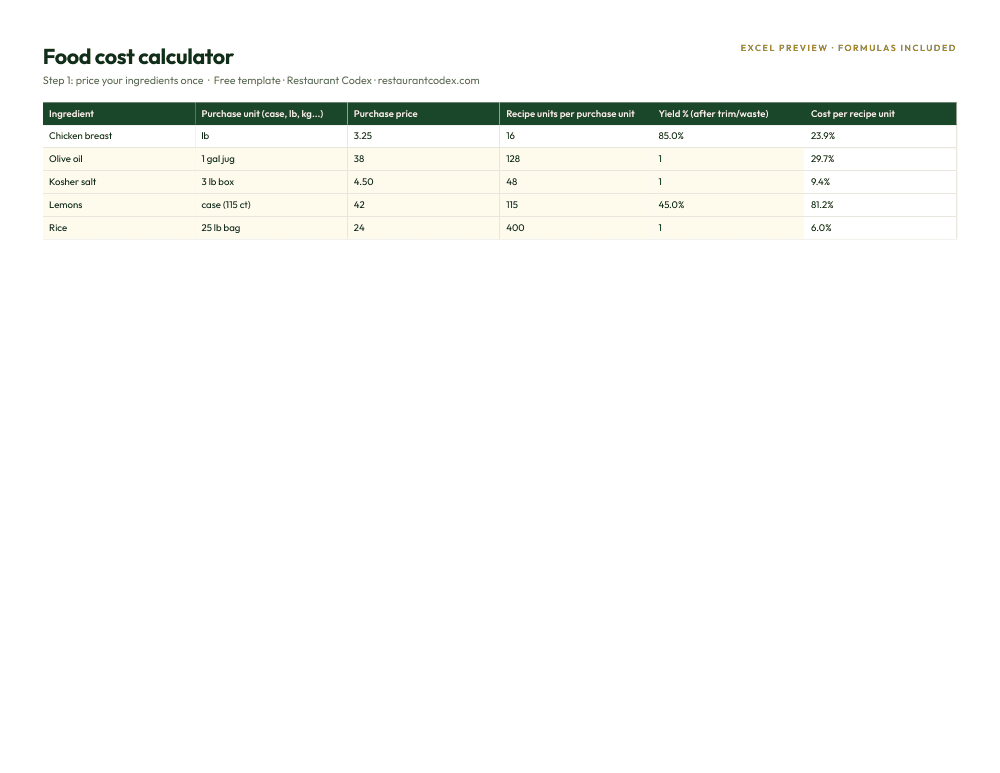
Two habits keep the numbers honest. Pull sales for a four-week cycle and average them, as Kasavana's example does, so a single odd week doesn't define a dish. And compare dishes only against their own group: entrées against entrées, and dinner against dinner if lunch sells a different menu. Kasavana segments the data by menu category and by meal period for the same reason.
How do you redesign a menu with the results?
Each box has a default move: keep the stars, reprice the plowhorses, reposition the puzzles, and remove the dogs (AHLEI, Part Two). Defaults are a starting point, and the arithmetic should confirm them before anything gets reprinted.
In the example, the cheeseburger is a plowhorse, so raise it $1.00 to $16.00. The margin goes from $10.80 to $11.80. The change pays for itself unless the burger loses more than 18 of its 220 plates ($2,376 ÷ $11.80 = 201.4 plates to break even). The ribeye is a puzzle, so put it where servers lead with it and guests see it first. Every ribeye ordered instead of a cheeseburger adds $10.80, which makes 20 swapped plates worth $216 a week. The veggie bowl is a dog, but look before you cut. If the bowl exists so a vegetarian doesn't veto the restaurant for a group of four, the bowl is earning something the table doesn't show. Recost the recipe first. A $1.00 cheaper bowl is worth $40 a week.
Here's what those moves add up to under made-up assumptions: the burger loses 10 plates, the chicken sandwich loses 5, and the ribeye gains 20.
| Change | Assumption | Weekly margin before and after |
|---|---|---|
| Cheeseburger to $16.00 | Sells 210, down from 220 | $2,376 to $2,478 (+$102) |
| Chicken sandwich, no change | Sells 175, down from 180 | $1,836 to $1,785 (-$51) |
| Ribeye led by servers | Sells 90, up from 70 | $1,512 to $1,944 (+$432) |
| Veggie bowl recosted | Cost $4.60, down from $5.60 | $416 to $456 (+$40) |
| Whole menu | 925 plates instead of 920 | $12,480 to $13,003 (+$523) |
Overall food cost barely moves, from 30.78% to 30.61%, while margin dollars rise by $523 a week. That's why the method counts dollars. The lines move too: the average margin rises to $14.06, and the ribeye, at 90 of 925 plates, climbs over the popularity line and becomes a star.
For the layout side, Kasavana's Part Three gives a list of common tactics, which he introduces as "representative of a majority of menu engineering strategies": a graphic or bold type on popular items, more enticing descriptions, dropping dollar signs and decimals, placing items with eye movement in mind, and limiting the number of options. It's a set of things to test, not a set of measured results, and the article doesn't claim any. Change one thing, watch plates sold for four weeks, and keep it only if the margin follows.

How often should you run menu engineering?
Run the full analysis twice a year, check results quarterly, and run it again whenever a major cost or a price changes. The twice-yearly rhythm comes from Kasavana's summary of Toast's Menu Engineering Bootcamp, which has menus revised twice a year and effectiveness tracked quarterly. Kasavana adds that recipe costs need to be updated and verified whenever a menu is re-engineered.
Costs move whether you act or not. The USDA's Economic Research Service reports that food-away-from-home prices were 3.5% higher in September 2026 than a year earlier, and it forecasts 3.5% for 2026 and 2.8% for 2027. Its beef and veal index fell 1.3% from August to September 2026 and was still 3.5% above the year before. Those are menu prices and retail-level indexes, not your invoice, but they show how fast the inputs shift. A 5% rise in the ribeye's cost, from $14.40 to $15.12, takes $0.72 off its $21.60 margin, and nobody touched the menu.
Use at least four weeks of sales each time, so a holiday week doesn't decide the verdict. Add a pass after any new dish, any supplier switch and any price change, and a quick look at the top five sellers each month.
How does menu engineering work across several locations?
Run it for each location first and compare afterward, because the same dish can be a star in one restaurant and a dog in another. Prices, local ingredient costs, the neighborhood and the menu mix all differ. Pool the sales and a busy location hides what a quiet one is telling you.
The comparison is where the value sits. A dish that's a puzzle in one restaurant and a star in another is a lesson in presentation or in what the servers say, so copy what the strong location does before you drop it from the weak one. A dish that's a dog nearly everywhere is a candidate for group-wide removal. And if the same dish has a very different cost per plate in two restaurants, that's usually a portion or purchasing difference, not a menu difference.
The recipe has to be the same recipe. A margin only describes the menu if each kitchen makes the dish to one spec; otherwise you're measuring cooks, not dishes. Consistency across locations is the groundwork.
Where Restaurant Codex fits
Menu engineering needs three inputs: trustworthy dish costs, plates sold per dish, and a person to make the call. Restaurant Codex covers the first input. Inventory reads supplier invoices line by line, flags price increases, tracks counts and waste, and shows food cost per location with a roll-up across all of them. The Knowledge Base holds the recipes with yield and photos. You can start without a POS feed or recipe mapping.
It doesn't replace the POS report that tells you how many of each dish sold, and it doesn't re-cost recipes on its own, so the sales export and the matrix stay a spreadsheet job. At Quanto Basta in Mexico City (Jorge Merino), margins have held at 28%, consistently, with menu engineering and inventory giving more control over food cost and waste. More restaurants are on the customers page.
Restaurant Codex
The same checklist, on every phone, with photo proof
Restaurant Codex runs this template as a live task with timestamps, photos and one view across every location. Bring it to a 30-minute working session and we'll show you how it would run across your locations.
By the Restaurant Codex team
Written with operators who run multi-location restaurant groups. Reviewed against the FDA Food Code and the sources listed below.
Sources
- AHLEI (Michael L. Kasavana), The Power of Menu Engineering, Part One: Introduction
- AHLEI (Michael L. Kasavana), The Power of Menu Engineering, Part Two: ME Analysis
- AHLEI (Michael L. Kasavana), The Power of Menu Engineering, Part Three: Making Adjustments
- USDA Economic Research Service, Food Price Outlook: Summary Findings
- WhippleWood CPAs, Financial Benchmarks for Restaurants, citing National Restaurant Association 2026 data