What is the 30/30/30 rule for restaurants?
The 30/30/30 rule is a shorthand for splitting a restaurant's sales three ways: about 30% to food costs, about 30% to labor, about 30% to overhead like rent, utilities and insurance, leaving roughly 10% as profit. It's one of the most repeated numbers in the industry, and it's also one of the hardest to trace. Parts Town, a foodservice equipment distributor, states the same three-way split that shows up almost word for word across a dozen vendor blogs, but none of them point back to a study, a trade association, or a named author. It reads less like a published standard and more like a number that got repeated until it sounded official.
The math is also the first problem. Full-service food cost averages 32.4% of sales and labor cost runs a 36.5% median, per National Restaurant Association 2026 data cited by WhippleWood CPAs. Add those two together and you're at 68.9% before a single dollar of rent, insurance or utilities gets counted, which already blows past the 60% the rule assumes food and labor should share. A rule built on three equal thirds doesn't survive contact with an industry where 42% of operators said they weren't profitable in 2025, per the National Restaurant Association.
That doesn't make 30/30/30 worthless, just imprecise. As a reminder to look at three separate buckets instead of one blended cost line, it still does a job. As a target to hit, it sets most full-service restaurants up to fail two of the three numbers before they've ordered their first case of chicken.
What is prime cost, and what should it be?
Prime cost is cost of goods sold plus total labor, added into one number, because those are the two costs that move with almost every decision a manager makes week to week. Rent doesn't change because Tuesday was slow. A schedule and a produce order do. Restaurant365 puts the target at 60% to 65% of revenue for a full-service restaurant and 55% to 60% for quick service, while WhippleWood's own number for the same ratio runs a touch wider, 55% to 65%. The gap between those two isn't a contradiction, it's a reminder that even "the" benchmark moves a few points depending on who's publishing it, and your own best week is a better scorecard than either one alone.
Here's how the number actually gets built, for a hypothetical 90-seat full-service restaurant's week. Say it posts $40,000 in net sales. Food and beverage purchases for the week run $12,000. Inventory dropped by $400 over the week, from $8,200 at the start down to $7,800 at the close, and that drawdown gets added to purchases because the kitchen used more than it bought. Cost of goods sold comes out to $12,400, or 31.0% of sales.


Labor for the same week: $8,400 in hourly wages, $2,600 in management salary, for $11,000 in gross wages. Payroll taxes and benefits add another 15%, or $1,650, for a total labor cost of $12,650, 31.6% of sales. Add the two together and prime cost lands at $25,050, 62.6% of sales, inside Restaurant365's 60% to 65% band and comfortably inside WhippleWood's wider one too. A single week landing here means almost nothing on its own. The same week landing here for a month in a row means the restaurant is running close to healthy.
What food cost percentage should a restaurant aim for?
A full-service restaurant should aim for 28% to 35% of sales going to food, with the current national average sitting at 32.4%, per National Restaurant Association data cited by WhippleWood. The formula behind that number is simple: food cost percentage equals cost per portion divided by menu price, and cost per portion is the sum of every ingredient's yield-adjusted cost, divided by how many portions the recipe makes.
Run it on a hypothetical plate to see where the points actually come from. Say a kitchen is costing a fettuccine with mushroom cream sauce, priced at $16.
| Ingredient | Qty used | Line cost |
|---|---|---|
| Fettuccine, dry | 5 oz | $0.56 |
| Cremini mushrooms (90% trim yield) | 6 oz | $1.46 |
| Heavy cream | 5 oz | $0.66 |
| Parmesan | 1.5 oz | $0.84 |
| Butter | 2 oz | $0.50 |
| Garlic, salt, herbs | flat rate | $0.30 |
Add the six lines and the dish costs $4.32 a portion. Against a $16 menu price, that's $4.32 divided by $16, or 27.0% food cost, a touch under the national average and comfortably inside the target band. It's also a reminder that the percentage alone doesn't tell the whole story: gross profit on this plate is $11.68, and a dish running a few points under target with strong profit per plate is doing its job better than a dish hitting 32.4% on the nose with a thinner dollar margin.
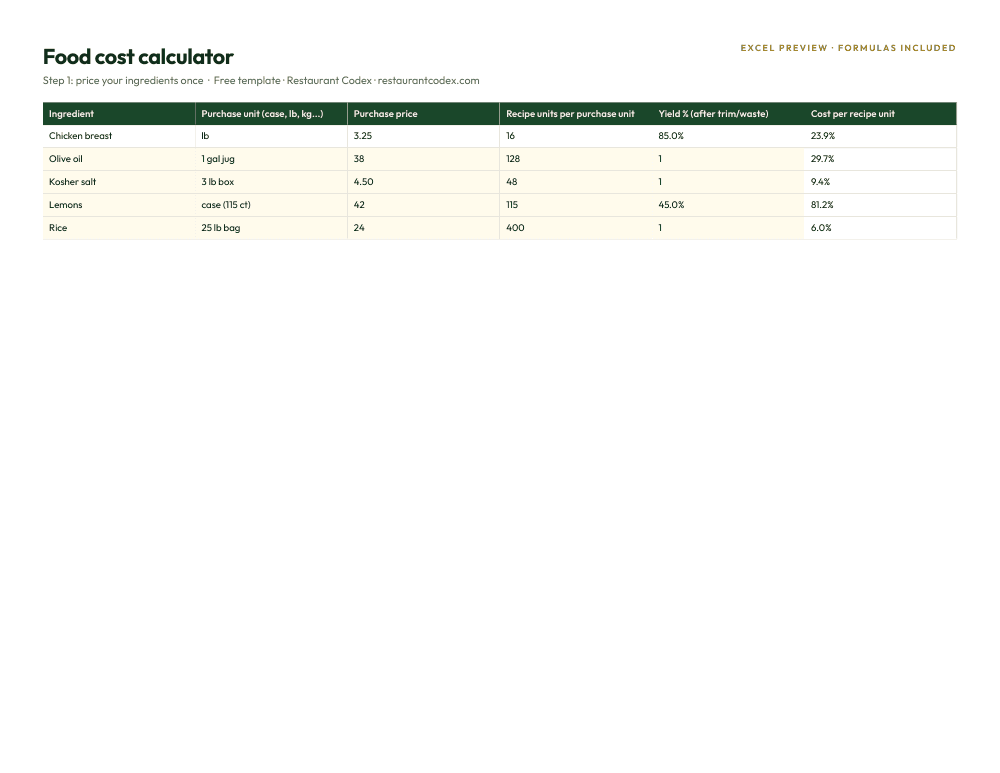
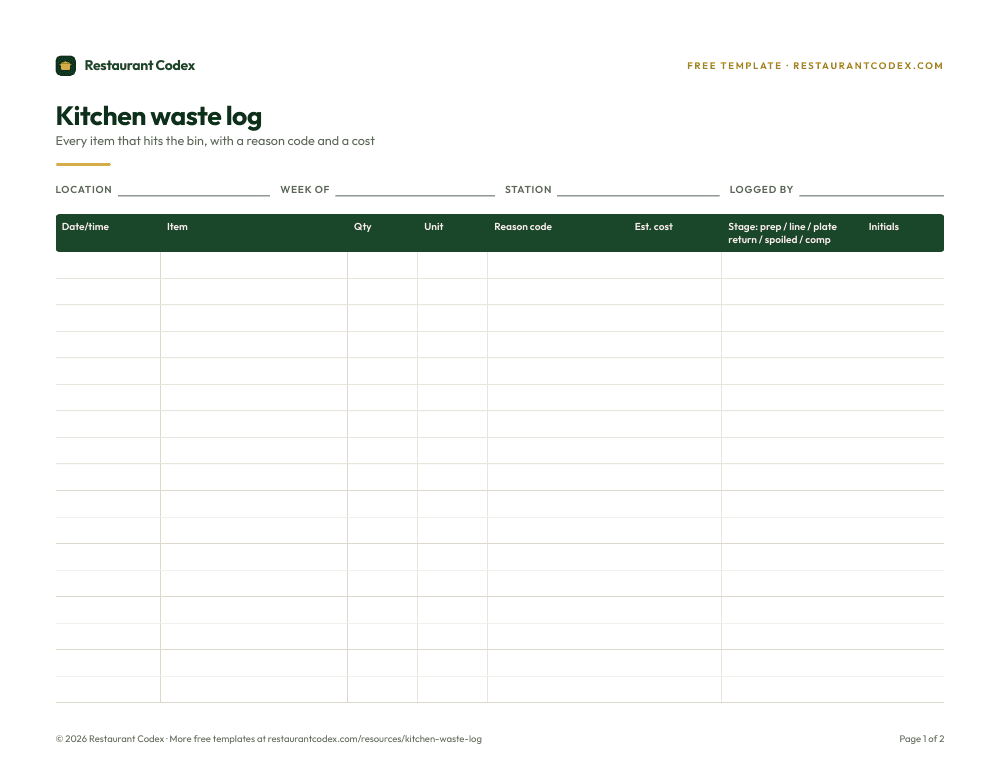
Jorge Merino's Quanto Basta in Mexico City holds 28% margins, consistently, built on menu engineering and inventory tracked in Restaurant Codex. That kind of consistency usually traces back to the same two habits: a recipe file that gets re-costed when a supplier price moves, and a waste log that catches drift before it shows up as a surprise on the monthly P&L. Food cost that's quietly climbing is rarely a pricing problem first; it's usually a kitchen-waste problem that nobody's logged by reason yet.
Is 25% labor cost high for a restaurant?
No, not on its own, and the answer depends entirely on what kind of restaurant is asking. Restaurant365 puts quick-service labor cost near 25%, casual dining at 25% to 30%, and fine dining at 30% to 35%, with a general target of 28% to 33% of revenue across concepts. 25% is close to typical for a quick-service operation with simpler menus and faster transactions, and it's low for a full-service restaurant, where labor cost runs a 36.5% national median, per the same NRA data cited by WhippleWood.
A number that low at a full-service restaurant is worth a second look either way, not just celebrating. It can mean a genuinely efficient floor plan and a well-built schedule. It can also mean a dining room that's short-staffed on purpose, running service thin enough that guests notice the wait and the kitchen runs ragged on a busy Friday. Labor cost percentage measures a ratio against sales, not whether the restaurant is adequately staffed to deliver the experience it's charging for, and an owner chasing the lowest possible number without watching table turns, ticket times and reviews is optimizing the wrong half of the equation.
What is the 60/40 rule for restaurants?
Two completely different rules share this name, and most pages online only know one of them. The financial version is shorthand for the prime cost target already covered above: keep combined food and labor near 60% of revenue, leaving roughly 40% for overhead and profit. It's not a separately published rule so much as a rounder way of saying what Restaurant365 and WhippleWood already publish as a range.
The other 60/40 rule was an actual law. Minneapolis required certain restaurants to pull at least 60% of their revenue from food and no more than 40% from alcohol, a rule that started in 1983 to keep bars in commercial districts from turning into neighborhood trouble spots. The city council repealed it unanimously on September 19, 2014, after years of operators arguing that pricier craft beer and cocktails had made the ratio nearly impossible to hit without raising food prices to compensate. A separate 70/30 version for restaurants in residential areas stayed on the books longer, since it was written into the city charter and needed a voter-approved change, not just a council vote.
Neither version is wrong, exactly. They're just unrelated rules that happen to share a catchy name, one a loose financial reminder that still gets repeated everywhere, the other a piece of 1980s liquor licensing that doesn't bind anyone outside the one city that wrote it, and barely binds there anymore either.
What are the three C's of a restaurant?
There isn't one. Ask a quality-systems group and a customer-experience consultant the same question and you'll get two different, equally real answers, and neither one is wrong, they're just answering different questions. SQFI, the food safety and quality certification body, defines its three C's as Conformance, Consistency and Cost: conformance is understanding what the customer actually expects, consistency is designing a process that reduces variation batch to batch, and cost is building quality into the process instead of catching failures at the end of the line.
FoodTruckOperator's version, aimed squarely at guest experience, lists Convenience, Consistency and Connection instead: frictionless ordering and payment, a brand that delivers the same quality at every visit, and a real relationship with the people eating there. The two lists share exactly one word, consistency, which shows up in both because it's the one thing a kitchen and a quality auditor and a guest all actually notice the moment it's missing. If someone asks you for "the three C's" without more context, that's the safest word to lead with. The rest depends on which job the person asking actually has.
Which cost rules break down once you run more than one location?
Every rule in this guide assumes one kitchen, one rent, one local labor market, and that assumption stops holding the moment a second location opens. Rent alone can swing a cost structure past recognition: a flagship paying premium downtown rent needs a tighter food and labor number just to clear the same overhead percentage as a satellite store paying a third of that rent in a quieter neighborhood, even if both kitchens are run equally well. A flat "overhead should be 30%" target punishes the first location and flatters the second for reasons that have nothing to do with how either one is actually managed.
Menus drift the same way. A regional special, a different produce vendor because of what's available locally, a slightly different build on a core item because a manager swapped something six months ago and never logged it, and two locations selling what looks like the same menu can carry genuinely different food costs without either one doing anything wrong. Running consistent recipes across locations is what keeps that drift from turning into an unexplained gap on the P&L.
The sharpest failure mode is the roll-up itself. A four-location group can report a blended prime cost of 63%, comfortably inside target, while one store is quietly running 74% and the other three are covering for it at 58% to 60%. Average the numbers across locations and the group looks healthy. Look at each store on its own line and one location is bleeding money every single week, hidden by three others doing fine. Multi-location groups that only ever look at the blended number are, by definition, the last ones to find out which store is actually the problem.
The rules, side by side
| Rule | What it says | Real benchmark | Verdict |
|---|---|---|---|
| 30/30/30 | Food 30%, labor 30%, overhead 30%, profit 10% | Food cost averages 32.4%, labor median 36.5% (NRA via WhippleWood) | The first two already total 68.9%; treat it as a reminder to track three buckets, not a target to hit |
| Prime cost | Food plus labor should sit near 60% of revenue | 60% to 65% full service, 55% to 60% QSR (Restaurant365); 55% to 65% (WhippleWood) | Holds up well as a weekly number, though the exact band moves a few points by source |
| Food cost | Food should run 28% to 35% of sales | 32.4% national average, full service (NRA via WhippleWood) | Useful as a sanity check, not a verdict; gross profit per plate matters more than the percentage alone |
| 60/40 | Keep combined food plus labor near 60%, or, in Minneapolis, keep food revenue at 60% and alcohol under 40% | Minneapolis's legal version ran 1983 to 2014, then was repealed | Two unrelated rules sharing a name; the financial one is a loose reminder, the legal one no longer binds anyone |
| Three C's | No fixed answer; versions include Conformance, Consistency, Cost and Convenience, Consistency, Connection | Neither is an industry standard | Only "consistency" shows up in every version, which is the one word worth remembering |
| 25% labor cost | "High" or "low" depends entirely on the concept | QSR near 25%, casual dining 25% to 30%, fine dining 30% to 35% (Restaurant365) | Low for full service, about right for quick service; meaningless without the concept attached |
Where Restaurant Codex fits
None of these rules get easier to hit just because a system is tracking them, and we don't pretend otherwise. What Restaurant Codex does is make the food side of the math real: supplier invoices read line by line with price increases flagged, counts on the phone with flags when stock doesn't add up, waste logged with a reason, and food cost per location with an all-locations roll-up in Inventory. Labor still comes from your scheduling and payroll system; Codex doesn't replace it. A prime cost percentage is only as honest as the two numbers that go into it.
Run your own numbers through the restaurant profit margin calculator before measuring yourself against any benchmark in this guide, including ours. A whole-fish, dry-aged-beef concept and a pasta-forward one can both be healthy restaurants sitting at very different food cost percentages, and a rule of thumb can tell you where to look. It can't tell you what grade you're getting.
Restaurant Codex
The same checklist, on every phone, with photo proof
Restaurant Codex runs this template as a live task with timestamps, photos and one view across every location. Bring it to a 30-minute working session and we'll show you how it would run across your locations.
By the Restaurant Codex team
Written with operators who run multi-location restaurant groups. Reviewed against the FDA Food Code and the sources listed below.
Sources
- National Restaurant Association, State of the Restaurant Industry 2026 press release: 42% of operators were not profitable last year
- Parts Town, What is the 30/30/30 Rule for Restaurants?
- WhippleWood CPAs, Financial Benchmarks for Restaurants, citing National Restaurant Association 2026 data
- Restaurant365, How to Calculate Prime Cost in a Restaurant
- Restaurant365, How To Calculate Restaurant Labor Costs Percentage
- Trepanier & Associates, Minneapolis City Council Repeals the 60-40 Food-to-Alcohol Ratio Law
- SQFI, Conformance, Consistency and Cost: the 3 C's of SQF Quality
- FoodTruckOperator, 3 C's in Customer Experience: Convenience, Consistency, Connection