How do you reduce food waste in a restaurant?
You reduce food waste by fixing three things before anything reaches a trash can: how much gets ordered, how well it gets stored, and how accurately it gets prepped. The bin at the end of the line is the last lever and the smallest one, not the first one to pull.
The EPA counted 66 million tons of wasted food across the food retail, food service and residential sectors combined in 2019, with almost 60% of it going to landfill. The agency doesn't break restaurants out from that combined number, so there's no clean "restaurants waste X%" figure to quote here. What the EPA does publish is a hierarchy, and it ranks source reduction, buying and using less in the first place, above every form of disposal, donation included.
Give the kitchen a way to log why an item died, not just that it did. A workable set is five stages: it got over-prepped, it got dropped or misfired on the line, a plate came back from a table, it spoiled in storage, or it went out as a comp. Each stage points at a different fix. Over-prepped rice three nights out of five is a par problem. A plate coming back twice a week for the same reason is a recipe or a training problem. Product dying in the walk-in before anyone touches it is an ordering or a FIFO problem. Without the stage attached, a pile of trash just looks like a pile of trash, and nobody can tell which of those they're actually solving.

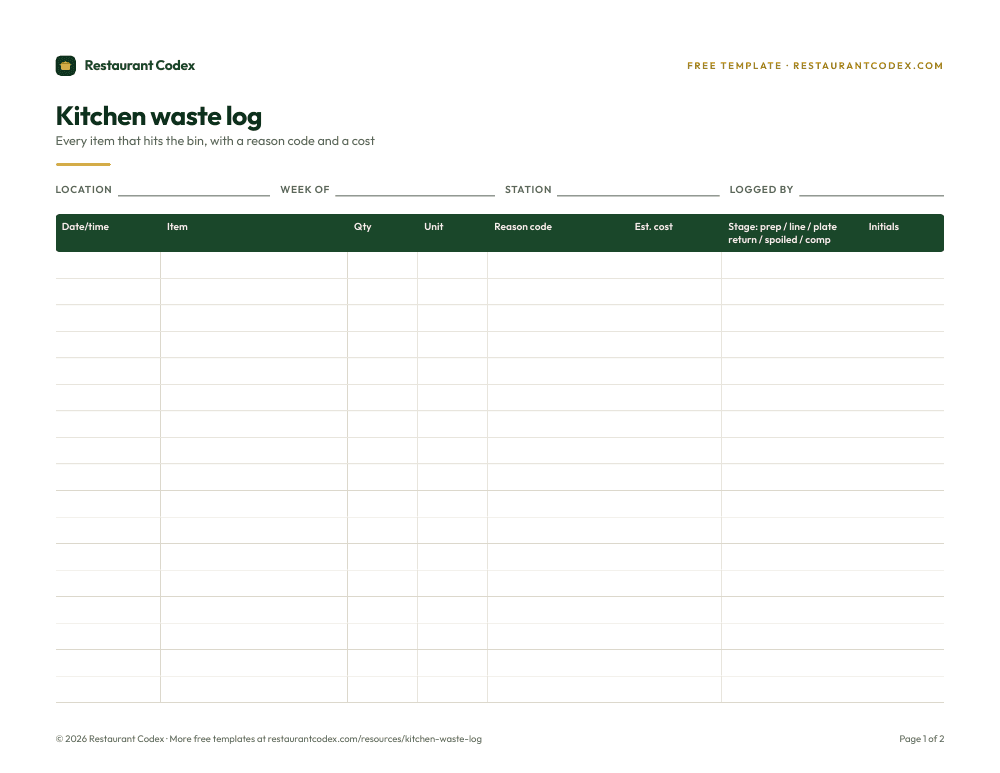
Run the arithmetic once and the size of the leak gets hard to ignore. Take a kitchen spending $15,000 a week on food and say 4% of that goes out as preventable waste. That's $600 a week, more than $31,000 a year, before a single guest ever sent a plate back. Run your own percentage; the point is that a number that looks small per shift doesn't stay small over a year. Two weeks of honest logging, sorted by stage, usually points straight at the biggest single fix.
Close it out with the parts that actually hold up under pressure: dates labeled so nothing outlives its shelf life quietly, a storage layout where the oldest case is the easy one to grab, and a closing checklist short enough that it still gets followed on a slammed Saturday instead of only during the manager's first week. A rule that only survives a slow Tuesday isn't a rule.
What are restaurant inventory management best practices?
The best inventory programs run on a calendar, not on whoever happens to have a free hour between shifts: a full count on a set day every week or month, plus faster cycle counts on the items where a miss actually costs money.
A full count of everything, weekly or on a defined monthly rhythm, is the baseline. Layer cycle counts on top for proteins, seafood and anything with a history of shrink, twice a week if the volume justifies it. After a big delivery lands or a private event blows through more product than normal, count the items involved before the next scheduled count, so a receiving error doesn't sit in the books for a week pretending to be theft.
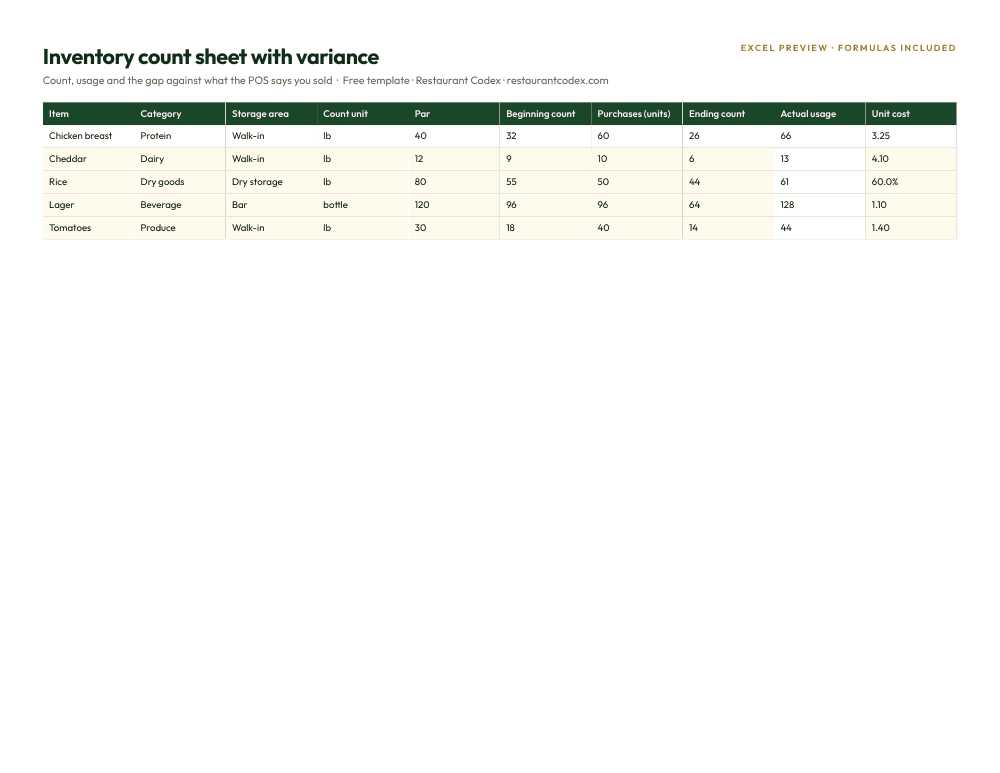
Get the unglamorous groundwork right before you touch software. Every item needs exactly one name across every sheet, one unit for both ordering and counting, a case one week and a pound the next breaks the whole trend line, and a storage map that actually matches where product sits on the shelf. Hand that sheet to someone who started last week; if they can't find the dry storage row from it, nobody's variance number means anything yet. Get the naming and the layout right on paper first, before you move counting into an inventory tool that just automates whatever mess is already there.
Split accountability on anything expensive. One person can walk dry storage and paper goods solo without much risk. Proteins, seafood and full liquor bottles are worth a second person, not because anyone's assumed to be stealing, but because a bad guess on a $14-a-pound ribeye moves the dollar total far more than the same kind of mistake on rice. Make the sign-off carry weight, too: a count that lands above your threshold gets looked at that same day by the chef and whoever received that week, not filed until someone happens to notice at month's end.
No government agency publishes an inventory variance target the way the FDA publishes a holding temperature. What exists is vendor consensus, RestaurantCalcs' published ranges being the most cited: food usually sitting between 1% and 3% in normal operation, liquor allowed more room at 3% to 5% because a heavy pour or a spilled well bottle adds up fast even behind a tight bar. Take it as a starting point, not a scorecard, and build your own baseline across eight to ten weeks of real counts before deciding what's normal for your kitchen specifically.
None of it means much disconnected from what the kitchen is actually cooking. A recipe card that still says four ounces of protein when the plate's been going out at six for months will pull the actual usage number away from the theoretical one every single week, and no amount of careful counting fixes a spec nobody's updated. Keep yields and plating specs current in the knowledge base so the count sheet and the kitchen are describing the same restaurant.

How do you build a reliable restaurant prep list system?
A prep list holds up when three things are true: the yield on every batch item is written down and accurate, the pars come from actual sales history instead of a gut feel, and someone specific owns each station's list every single shift.
Start with the yield question, because it's the one most kitchens skip. If a batch of braised short rib yields 22 portions and the recipe card still says 18, every par built on top of that number is wrong before the cook even starts cooking. Pair the yield with a real shelf life and a pull time, how far ahead of service the item actually needs to come out, so "ready" means the same thing to the person prepping it and the person plating it.
Set the actual quantities from history, not instinct. Pull two weeks of notes on what ran out, what got thrown away, and how often each item got 86'd, then set a different par for each day of the week instead of one number stretched across all seven. A Tuesday lunch and a Saturday dinner rarely move the same volume, and a single flat par either leaves Saturday short-handed or buries Tuesday's line in prep that's headed for the waste log by Wednesday. When a promotion or a private event is coming, write the extra quantity into that day's list directly; leaving it to a verbal heads-up means it only reaches the cook who happened to be standing there when someone mentioned it.
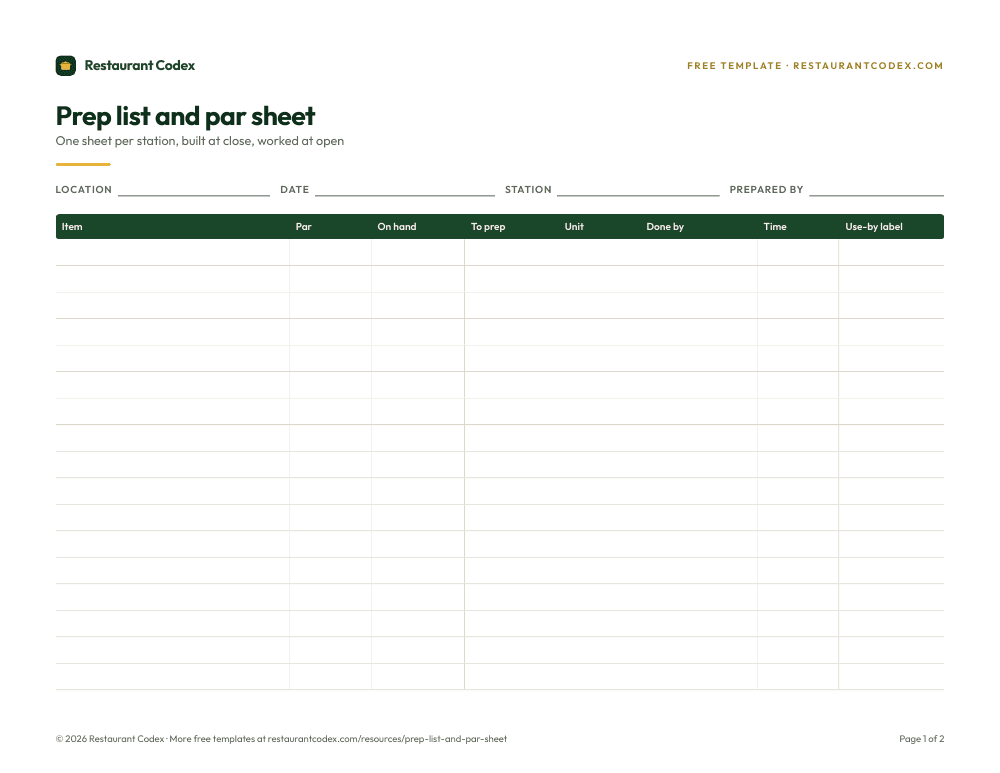
Put a name and a time on every line. A list with no owner quietly becomes the job of whoever clocked in first, which means it gets done differently depending on who that happens to be that day. When a station starts falling behind mid-shift, that needs to reach the expo before the ticket rail backs up, not get discovered when a table's been waiting fifteen minutes for a side that was never made.
Over-prepping isn't a rounding error, either. It's a direct contributor to the EPA's 66-million-ton wasted food count for 2019, just measured one hotel pan at a time instead of across a whole country. A par that's wrong Thursday after Thursday is a small, fixable piece of that same combined figure.
Once one kitchen has this running smoothly for a few weeks, that's the point to build it into your operations system rather than leave it as a habit one strong sous chef carries in their head. Locked into a shared tool, the open and midday prep windows stop depending on which manager is running the shift that day, and a new location can start from the same rhythm on day one instead of building its own from scratch.
A worked example: what a bad week actually costs
Doubling the top of the accepted food-variance band costs the same kitchen about $600 more a week, and that's the whole argument for counting properly. Run the $15,000-a-week kitchen from the first section through an inventory lens. A variance sitting inside the accepted 1% to 3% food band is normal friction, call it $300 a week at the low end. At 6% it's roughly $900 a week going somewhere: bad portioning, unlogged waste masquerading as shrink, or a recipe card nobody's updated. That's over $46,000 a year, and it's usually cheaper to find than most owners assume, because the fix is almost always sitting inside the prep list or the waste log, not a new vendor contract.
| Metric | Target | Source |
|---|---|---|
| Food cost, full service | 28% to 35% of sales (32.4% average, 2026) | National Restaurant Association |
| Prime cost, full service | 55% to 65% of revenue | National Restaurant Association |
| Inventory variance, food | 1% to 3% | RestaurantCalcs |
| Inventory variance, liquor | 3% to 5% | RestaurantCalcs |
| Cold holding | 41°F or below | FDA Food Code |
| Hot holding | 135°F or above | FDA Food Code |
Run your own numbers through the restaurant profit margin calculator before comparing yourself to any of these. A concept built around a high-waste protein, whole fish, dry-aged beef, sits differently on food cost than a pasta-heavy menu, even when both kitchens are running clean. These targets tell you where to look, not what grade you're getting. For the per-dish math behind them, the food cost calculator does the work at the recipe level.
Running waste and inventory across multiple locations
A group running more than a couple of locations standardizes the language before it standardizes anything else. If one kitchen logs "86'd" and another writes "ran out" and a third just leaves the line blank, an ops director comparing five stores is doing translation work instead of looking at data. The same reason codes, the same units, the same day-of-week structure, at every store, is what makes a real comparison possible.
Compare by percentage, not raw dollars, once the vocabulary lines up. A flagship doing four times the volume of a satellite store will always show a bigger dollar variance even when it's the tighter-run kitchen of the two, so ranking stores by dollar loss alone punishes the busiest one for being busy. Percentage against volume is the fairer read, and it's usually the one that surprises an owner who assumed the small store was the well-run one. The targets themselves don't move by store size or market, either: RestaurantCalcs' 1% to 3% food-variance band and the FDA's 41°F cold-holding line apply the same way to a 40-seat store and a 200-seat one.
Split ownership deliberately. HQ owns the method: the column layout on the count sheet, the four-week trailing-average approach to setting pars, the reason codes, the FIFO rule. Each GM owns their own store's actual numbers, because a 40-seat neighborhood spot and a 200-seat destination restaurant shouldn't share a par for the same dish even if the menu is identical on paper. Someone above the store level, a chef or an operations lead, needs to look at pars, waste and variance across every location on a monthly cadence, side by side. That review is what catches the location still running a par nobody updated after last quarter's menu change, months after everyone stopped noticing locally. For what else shifts once a group crosses that threshold, see how to run a multi-location restaurant group.
Where waste and inventory systems break down
Most waste and inventory programs fail on the reading, not the recording: the sheets get filled in and nobody changes a par, an order or a recipe because of them. Five ways that happens.
Logging what got thrown out, not why. A waste sheet with just an item and a quantity column is a tally, not a diagnostic. Add a reason code, or the biggest number on the page tells you nothing about what to actually change.
Treating a bad number as a verdict instead of a lead. A row that comes in high on the variance report gets read as proof someone's stealing before anyone's checked whether it's a portioning issue, an unlogged spill, or a case counted in pounds one week and cases the next. Theft happens. It's also the last thing to check, not the first.
Skipping the connection between the two logs. A manager who reads the waste sheet in isolation sees the same protein flagged as over-prepped week after week and never touches the par causing it. The waste log is the symptom. The prep list is where the actual fix gets written down, and neither one does much good read alone.
Letting a walk-in drift without anyone noticing until it's too late. A compressor running warm for six hours doesn't show up as a mistake on any sheet until the fish inside it has already spoiled. Cold holding at 41°F or below and hot holding at 135°F or above aren't paperwork requirements, they're the line between a case you can still serve and one that's headed for the reason-code column marked spoiled, no matter how carefully it was ordered or prepped. For the fuller rundown on holding times and cooling windows, see the food safety compliance guide.
Reacting to a single bad week. One slow Tuesday or one big private event will throw off a waste percentage or a variance number on its own, no systemic problem required. Look at a rolling few weeks before deciding a number means something.
Where Restaurant Codex fits
Restaurant Codex puts the waste log, the count sheet and the prep list in one system so they finally talk to each other. A reason code logged on the waste board, a variance flagged on this week's count, and a par sitting on the prep list all draw from the same underlying data instead of living in three binders nobody cross-references on a busy week. A chef watching five locations can see which store's fish waste lines up with which store's par being set too high, in one screen, instead of asking five kitchens to explain their own numbers separately. Recipe yields and specs stay current in the knowledge base, and the counting and logging run as scheduled operational tasks rather than something that depends on whoever remembers to do it that week. None of it replaces the judgment call about whether a number is a training issue or a supplier issue. It just means everyone's looking at the same picture when they make that call.
Restaurant Codex
The same checklist, on every phone, with photo proof
Restaurant Codex runs this template as a live task with timestamps, photos and one view across every location. Bring it to a 30-minute working session and we'll set it up on your real operation.
By the Restaurant Codex team
Written with operators who run multi-location restaurant groups. Reviewed against the FDA Food Code and the sources listed below.
Sources
- EPA, Food Material-Specific Data (Wasted Food Report, 2019)
- EPA, Wasted Food Scale
- FDA Food Code 2022 (cold holding, hot holding, two-stage cooling)
- WhippleWood CPAs, Financial Benchmarks for Restaurants, citing National Restaurant Association 2026 data
- RestaurantCalcs, Inventory Variance calculator
- RestaurantCalcs, Liquor Pour Cost calculator