How do you cost a recipe?
You cost a recipe by working out what one usable ounce of each ingredient costs, multiplying by the amount that goes into a portion, adding the lines, and dividing by the portions the recipe actually produces. Do it in this order:
- List what goes into one portion, in the unit you'll weigh it in, as it ends up on the plate (peeled, trimmed or cooked).
- Take the price you paid per pound or kilo as bought.
- Divide that price by the ingredient's yield to get the cost of a usable unit.
- Multiply by the portion quantity.
- Add a flat line for pantry items, then sum everything.
Here's a hypothetical beef stew, 20 portions per batch. The yields come from the USDA tables in the next section, and the prices and portion sizes are made up.
| Ingredient | Price as bought | Yield | In one portion | Cost ignoring yield | Cost with yield |
|---|---|---|---|---|---|
| Beef stew meat | $7.20/lb | 61% (to cooked) | 5 oz cooked | $2.25 | $3.69 |
| Onions | $1.10/lb | 88% | 2 oz peeled | $0.14 | $0.16 |
| Carrots | $1.00/lb | 83% | 2.5 oz trimmed | $0.16 | $0.19 |
| Potatoes | $0.90/lb | 81% | 4 oz pared | $0.23 | $0.28 |
| Stock, tomato paste, oil, spices | pantry | n/a | flat share | $0.29 | $0.29 |
| Portion total | $3.07 | $4.61 |
Take the beef row. A portion holds 5 oz of cooked meat, which is 0.3125 lb. At $7.20 a pound that looks like $2.25. But a pound of raw stew meat gives only 0.61 lb cooked, so the meat in the bowl costs $7.20 ÷ 0.61 = $11.80 per cooked pound, and 0.3125 × $11.80 = $3.69. The rest of the rows work the same way. A 20-portion batch costs $4.61 × 20 = $92.20.
What is yield, and why does it change a recipe's cost?
Yield is the share of what you buy that ends up usable on the plate, and dividing the price by it gives the cost of the portion you serve. A 61% yield means 39% of the purchased weight is lost to trim, bone, fat or cooking, and you still paid for all of it.
The USDA's Food Buying Guide publishes yield tables by food category. A few that apply to the stew, in the USDA's own measures:
| Food (USDA table) | 1 lb as purchased gives | Yield |
|---|---|---|
| Mature onions, fresh, whole | 0.88 lb ready-to-cook raw onion | 88% |
| Carrots, fresh, without tops | 0.83 lb trimmed, peeled, chopped | 83% |
| Potatoes, fresh | 0.81 lb pared, ready to cook | 81% |
| Beef stew meat, trimmed retail cuts, boneless | 0.61 lb cooked lean meat | 61% |
| Pork stew meat | 0.58 lb cooked | 58% |
| Whole chicken, no neck or giblets | 0.44 lb cooked boned meat with skin, 0.36 lb without | 44% / 36% |
Those are averages for specific forms and methods. The California Department of Social Services lists what moves them: product quality, storage, equipment, cooking method and time, the form it's served in, and portion control. Your cooks, knives and ovens will land somewhere else, so the USDA figure is where you start and a test is where you finish.
The test is simple. CDSS's in-house study has two people work independently on three samples each, six in all, then averages the results and rounds down. Its version counts servings per sample; for a recipe, weigh what you bought, process it the way the recipe does, weigh what's usable, and divide. Write the number on the recipe card. Do it again when the cut, the supplier or the cooking method changes. Yield isn't the same as 1 minus waste when you price: divide by 0.61, don't add 39% to the price. Adding gives $10.01 a pound, and dividing gives the correct $11.80.

How do you price a dish from its cost?
You price a dish by dividing its portion cost by the food cost percentage you're aiming for, then rounding to a menu price. With the stew at $4.61, the targets look like this:
| Target food cost | Price needed | Margin per plate |
|---|---|---|
| 28% | $16.46 | $11.85 |
| 30% | $15.37 | $10.76 |
| 32.4% | $14.23 | $9.62 |
| 35% | $13.17 | $8.56 |
WhippleWood CPAs, citing National Restaurant Association 2026 data, gives 28% to 35% as the usual range for food cost and 32.4% as the full-service average. Round up to a price guests will recognize, say $15.50, which gives a food cost of 29.7% on this dish.
The wrong cost gives a confident wrong price. Price the stew from $3.07 at 30% and you get $10.23. Print $10.50 and the real food cost is $4.61 ÷ $10.50 = 43.9%, which no one notices until the month-end count disagrees with the sheet.
Percent targets are a floor, not the whole answer. A dish at 35% can still earn more dollars per plate than one at 25%, and the market has a say in the price. Menu engineering is how you decide where a dish sits once you have its cost.
How often should you update recipe costs?
Update a recipe's cost whenever the price of one of its big ingredients moves, and re-cost the whole menu when you change it. Kasavana's AHLEI series says recipe costing needs to be updated and verified whenever the menu is re-engineered.
The size of the move matters less than the size of the ingredient. In the stew, a 33% jump in onions adds $0.05 to a portion, because onions are $0.16 of $4.61. A 5% rise in beef, from $7.20 to $7.56 a pound, adds $0.18, and at 150 portions a week that is $27. Our rule: re-cost when an invoice moves one of a recipe's two or three biggest lines by about 5%. That's a rule of thumb, not a published standard.
Prices do move. The USDA Economic Research Service's October 2026 outlook has food-at-home prices up 1.8% over September 2025, beef and veal up 3.5% over the year but down 1.3% from August to September, and food-at-home prices averaging 2.6% a year from 2006 to 2025. A sheet last touched in spring can be off in October without anyone having done anything wrong.
Is recipe costing better in Excel or in software?
A spreadsheet is fine for one kitchen with a modest number of recipes and one person who owns it, and software starts to pay off when prices, recipes or locations multiply faster than that person can keep up.
Spreadsheets fail quietly. A literature review by EuSpRIG, citing Panko's 1998 audits, reports that 94% of 88 audited spreadsheets contained errors, and the average cell error rate was 5.2%. Those were business spreadsheets, not recipe sheets, but a costing sheet has the same weakness: a hard-coded price, a stale yield, a formula dragged one row too far.
| Situation | Spreadsheet works when | Software earns its place when |
|---|---|---|
| One kitchen | One owner keeps it current and someone else checks it | Prices change weekly and nobody has the time |
| Several locations | You can keep one master and one price column per location | Each location buys from different suppliers at different prices |
| Recipe changes | A single person edits | Cooks need the current card, with photo and allergens, on the line |
| Price alerts | You read invoices yourself | You want increases flagged as invoices come in |
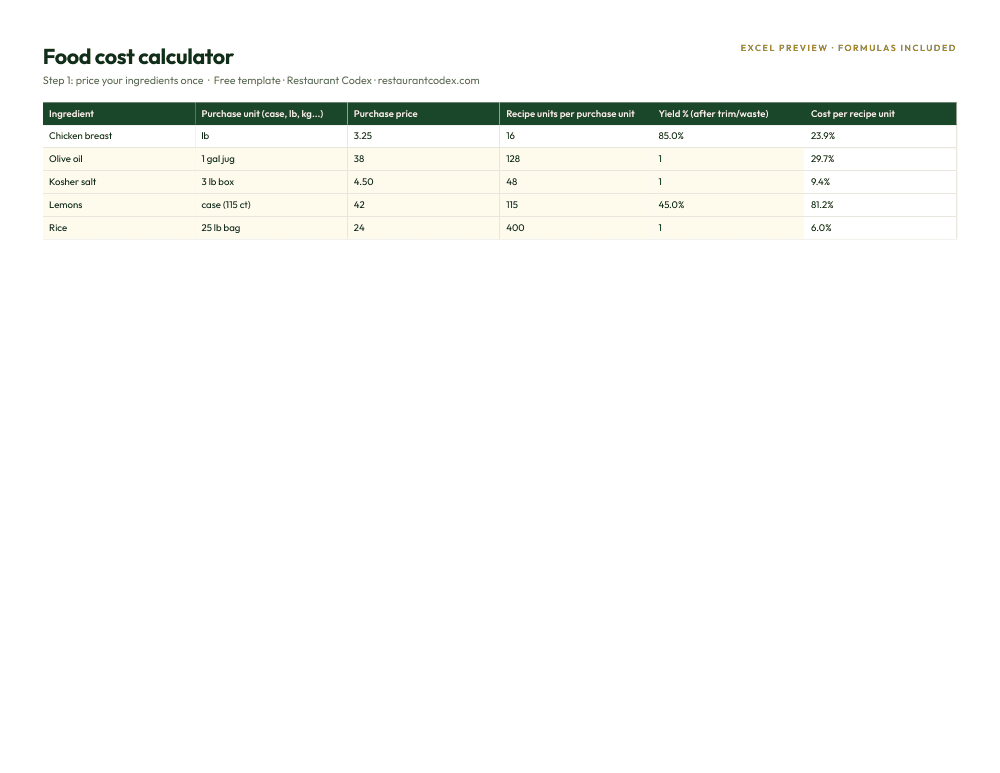
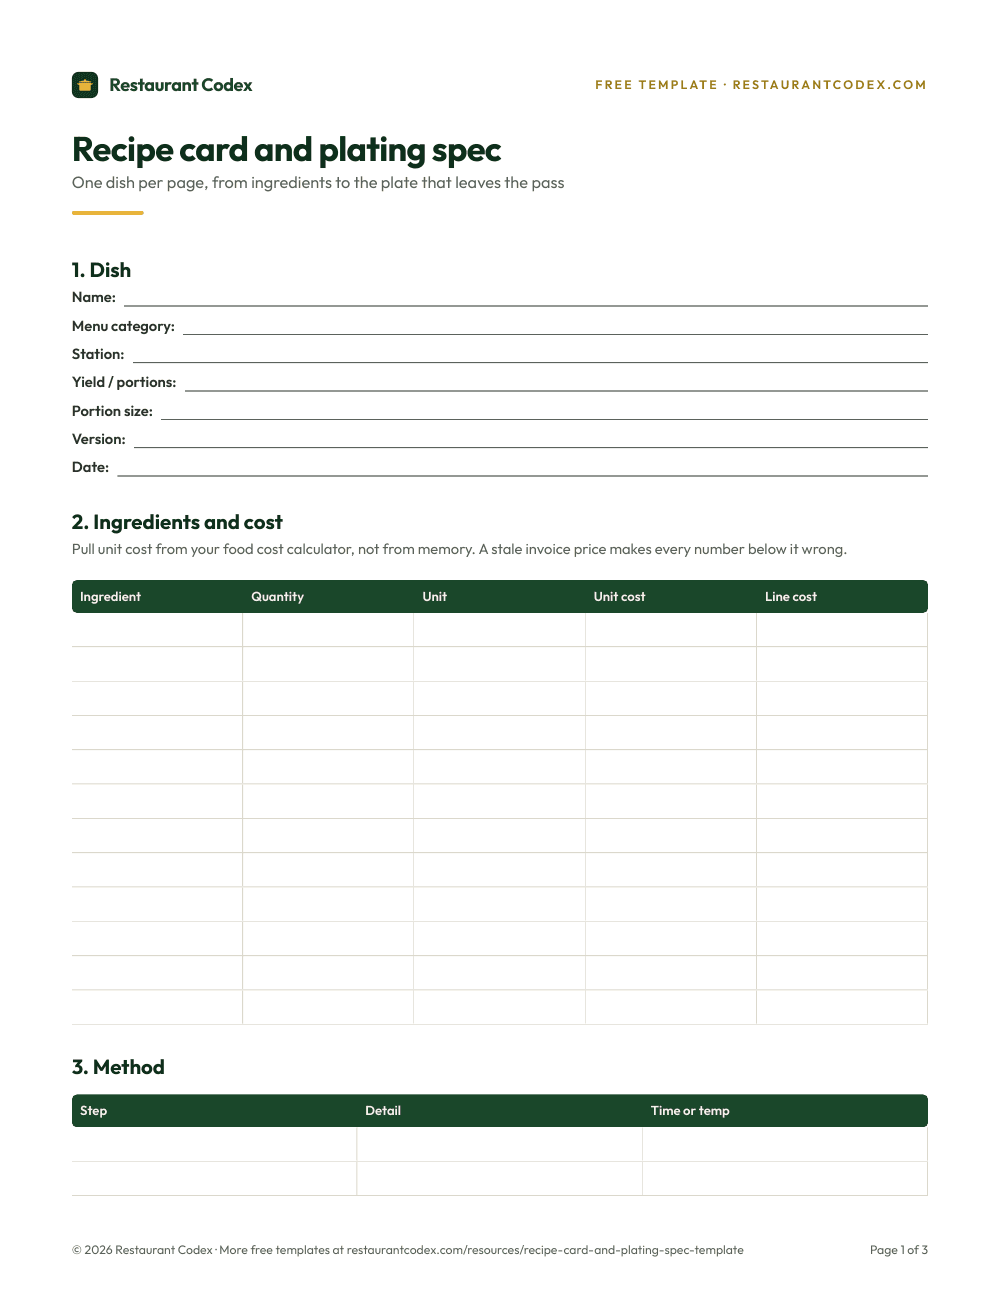
Whichever you pick, the structure is the same as above: price as bought, yield, usable quantity, line cost. The food cost calculator template is a place to start, and a second person should check the first version line by line.
How do recipe costs work across several locations?
Keep one recipe, with one set of quantities and one tested yield, and cost it separately in each location at that location's prices. The recipe is the group's. The prices are local, and the yield is whatever each kitchen can show.
Same stew, three hypothetical kitchens, each pricing it at $15.50:
| Location | Stew meat price | Tested yield | Beef per portion | Portion cost | Food cost at $15.50 |
|---|---|---|---|---|---|
| A | $7.20/lb | 61% | $3.69 | $4.61 | 29.7% |
| B | $7.90/lb | 61% | $4.05 | $4.97 | 32.1% |
| C | $7.20/lb | 55% | $4.09 | $5.01 | 32.3% |
B and C both run about 2.5 points above A, for different reasons. B pays more for the same meat, which is a purchasing question. C pays the same price and gets less from it, which is a kitchen question: temperature, trim or portioning. If you only look at the group average you'll treat both as one problem. The fix for each is different, and so is the person who owns it.
For a group, the practical rule is a single master recipe, a yield test done in every kitchen, and a food cost per location that you compare weekly. Recipe management covers how to keep the master current.
What is the difference between batch cost and plate cost?
Batch cost is what a whole preparation costs, and plate cost is what one finished dish costs once every component is added. The stew batch costs $92.20 for 20 portions, so $4.61 a portion. The plate adds a roll with butter at $0.40 and a garnish at $0.05, which makes the plate cost $5.06.
Batches also lose portions. If the same batch gets 19 portions out of 20 because of a tasting, a spill or a heavier hand with the ladle, the cost per portion is $92.20 ÷ 19 = $4.85, which is 5.2% higher. The recipe says 20 and the kitchen serves 19, and only a count or a spot check shows the gap. Cost sub-recipes such as sauces and stocks as batches, then feed their cost per ounce into the plate.

Where Restaurant Codex fits
Restaurant Codex keeps the pieces around costing in one place; it doesn't do the costing for you. The Knowledge Base holds recipes with allergens, photos, yield and shelf life, so the card a cook follows is the same one you costed. Inventory reads supplier invoices line by line and flags price increases, which tells you which recipes just got more expensive, and it shows food cost per location with a roll-up across all of them. It doesn't re-cost recipes automatically, so the update itself is still a job for your spreadsheet or calculator.
At Tapiz Bistro & Bakery in Mexico City, the team structured 220 recipes in two weeks in Restaurant Codex so everyone works from the same standards. More restaurants are on the customers page.
Restaurant Codex
The same checklist, on every phone, with photo proof
Restaurant Codex runs this template as a live task with timestamps, photos and one view across every location. Bring it to a 30-minute working session and we'll show you how it would run across your locations.
By the Restaurant Codex team
Written with operators who run multi-location restaurant groups. Reviewed against the FDA Food Code and the sources listed below.
Sources
- USDA Food and Nutrition Service, Food Buying Guide for Child Nutrition Programs, Section 1: Meats/Meat Alternates yield table
- USDA Food and Nutrition Service, Food Buying Guide for Child Nutrition Programs, Section 2: Vegetables yield table
- California Department of Social Services, FBG Yield Tables and In-House Yield
- AHLEI (Michael L. Kasavana), The Power of Menu Engineering, Part One: Introduction
- WhippleWood CPAs, Financial Benchmarks for Restaurants, citing National Restaurant Association 2026 data
- USDA Economic Research Service, Food Price Outlook: Summary Findings
- EuSpRIG (Rittweger and Langan), Spreadsheet Risk Management in Organisations