How do you do a restaurant inventory count?
You do a count by tallying every food and drink item on hand at one agreed time, in a fixed order, in the unit you buy it in, and then pricing each line at what you paid. This is the order that works:
- Pick a time and hold it. After close, on the same day every week. No deliveries are received and no transfers move during the count.
- Use one list. Items in shelf order: walk-in, reach-ins, freezer, dry storage, bar. One line per item, with the purchase unit (case, bag, kilo, bottle).
- Count in that order. One person counts out loud and one writes, or one person counts and enters on a phone. Count partial packs by weight or in tenths, and write the number rather than rounding.
- Include prepped food. A pan of sauce in the walk-in is inventory. Cost it at the batch cost per unit, the way recipe costing does.
- Price it. Quantity times the latest invoice unit cost.
- Total by category. Protein, produce, dairy, dry goods, bar. You'll need the split in the variance step.
IRS Publication 334 describes the basic count sheet: columns for description, quantity, unit price and value, and space on each page to record who made the physical count, who priced the items, who made the extensions and who proofread the calculations. Those four jobs are a useful checklist even if one person does two of them.
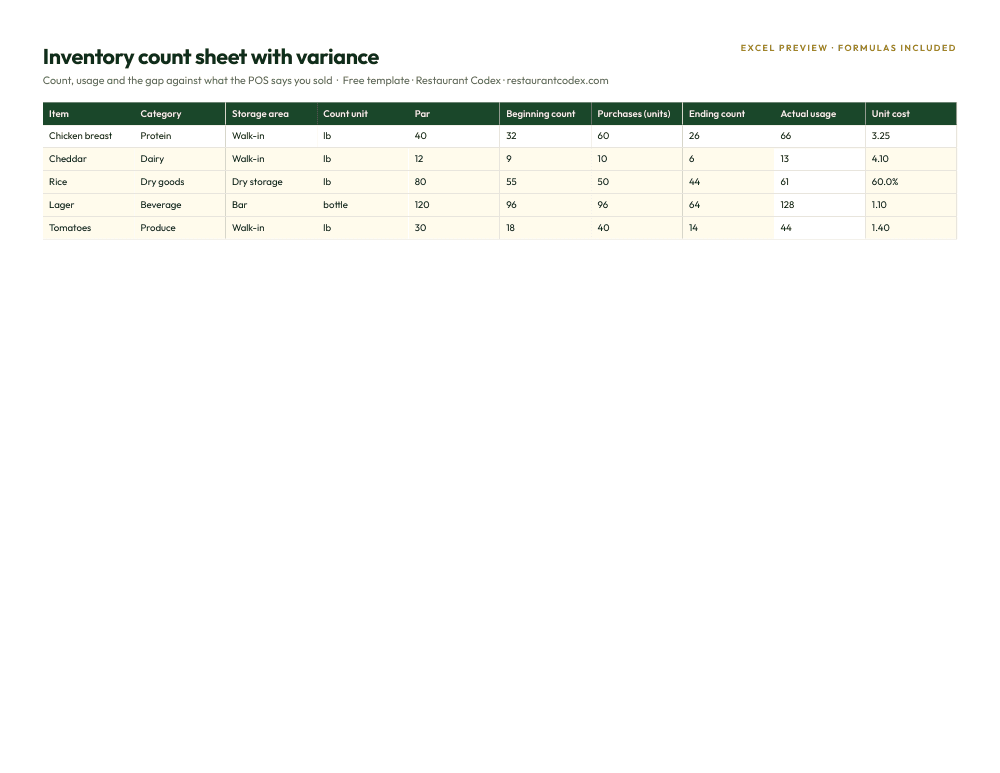
Then calculate usage: beginning inventory, plus purchases received during the period, minus ending inventory. The IRS's cost of goods sold example for a retail business has the same shape: $37,845 beginning inventory plus $285,900 purchases, minus $2,650 withdrawn for personal use, minus $32,955 ending inventory, gives $288,140.
How often should a restaurant count inventory?
Count the whole restaurant once a week, count high-value items more often, and treat the once-a-year count taxes ask for as a floor and not a routine. RestaurantCalcs, which makes restaurant calculators, says monthly hides too much, daily is too noisy, and "weekly catches drift early enough to fix the next week." That's a vendor's guidance, but the logic holds: a monthly count shows a problem up to four weeks after it began.
The tax side is separate. Publication 334 says you must value your inventory at the beginning and end of each tax year to determine your cost of goods sold. How that applies to a restaurant is a question for your accountant, and a year-end count tells you nothing about this month's food cost.
Our suggested cadence, which is a recommendation and not a published standard:
| Item group | Count | Why |
|---|---|---|
| Liquor, premium proteins, seafood | One extra short count mid-week | High cost per unit means small errors cost real money |
| Everything else | Weekly, same day and time | Catches drift in a week and makes weeks comparable |
| Dry goods and packaging | Weekly or every second week | Slow movers; the count is quick and rarely changes |
| Full count for the books | Month end (a weekly count that lands on it) | Closes the P&L on a real number |
What is inventory variance?
Inventory variance is the gap between the food you actually used and the food your sales say you should have used. Actual usage is beginning inventory plus purchases minus ending inventory. Theoretical usage is what you sold, item by item, multiplied by each dish's recipe cost.
Here is a hypothetical week at one restaurant with $34,000 in food sales:
- Beginning inventory (last Monday's count): $18,400
- Purchases received during the week: $9,600
- Ending inventory (this Monday's count): $17,680
- Actual usage: $18,400 + $9,600 - $17,680 = $10,320, or 30.35% of sales
- Theoretical usage, from POS item sales times recipe costs: $10,000, or 29.41% of sales
- Variance: $320 over, which is 3.2% of theoretical usage and 0.94 points of food cost
By category, the picture changes:
| Category | Theoretical | Actual | Variance | Variance % of theoretical |
|---|---|---|---|---|
| Protein | $4,000 | $4,210 | +$210 | 5.25% |
| Produce | $2,300 | $2,360 | +$60 | 2.6% |
| Dairy and eggs | $1,200 | $1,230 | +$30 | 2.5% |
| Dry goods | $2,500 | $2,520 | +$20 | 0.8% |
| Total | $10,000 | $10,320 | +$320 | 3.2% |

RestaurantCalcs bands: under 1% is best in class, 1% to 3% is acceptable, 3% to 5% should be investigated, 5% to 8% is a red flag, and over 8% means the counts are unreliable. The blended 3.2% sits just inside "investigate". Protein, at 5.25%, is in the red-flag band, and two-thirds of the dollars are there. Splitting by category is what points you at the walk-in instead of the whole building. If the same pattern ran for 52 weeks, $320 a week would be $16,640 a year.
One caution: RestaurantCalcs gives two versions of the formula, one as a share of theoretical usage and one as the difference in food cost percentage, and doesn't say which its bands assume. Pick one, write it down and use it every week. The example above uses a share of theoretical usage and also shows the point difference.
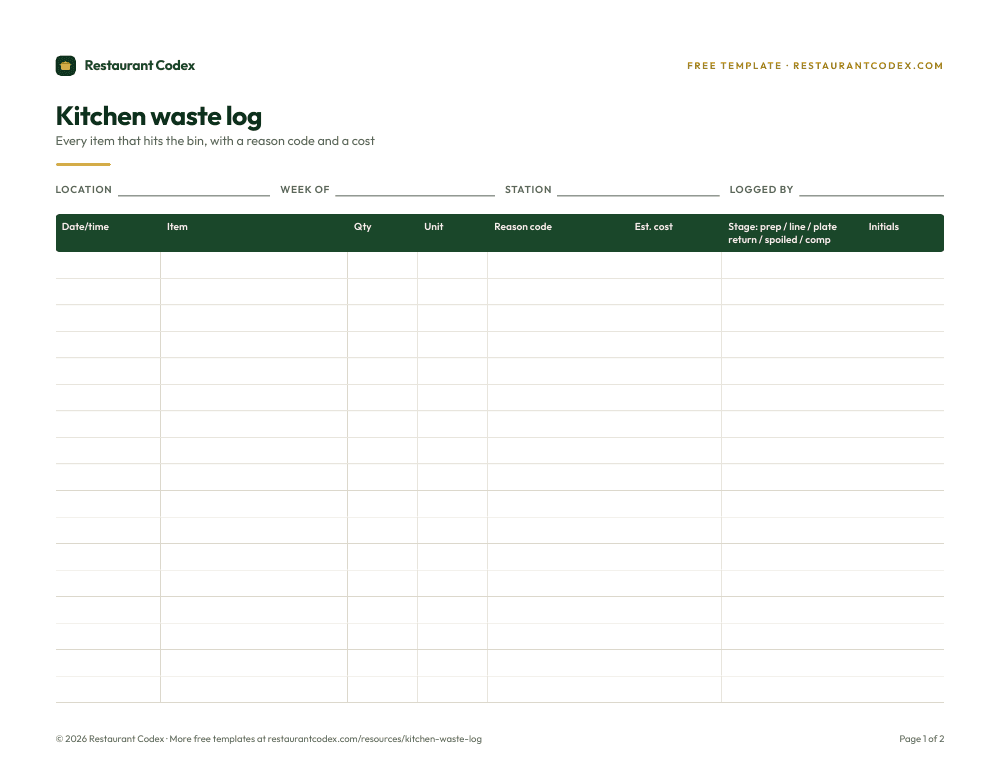
Waste you've logged with a reason isn't a mystery. If $90 of produce went in the bin and the log says so, that part of the variance is explained and the rest is what you still need to find.
How do storage and FIFO keep counts accurate?
Storage and FIFO keep counts accurate because stock that sits in a fixed place, labeled and dated, is counted once and counted correctly. FIFO means first in, first out: new deliveries go behind older stock, so the oldest product gets used first and nothing expires at the back of the shelf.
Three habits make the count faster and the numbers cleaner:
- One home per item. The count sheet follows the shelves. If the same item lives in three places, it gets counted twice or not at all.
- Label and date. The UNH Extension, summarizing the FDA Food Code, says ready-to-eat refrigerated food prepared on site or opened must be labeled and dated if it stays more than 24 hours, and not kept more than 7 days. A date on the container means the person counting knows what is still good.
- Pull expired product out, then log it. Expired stock counted as inventory inflates your ending number and hides the loss. Throwing it out without a note moves the loss into variance with no explanation.
Who should count restaurant inventory?
The person who counts should not be the only person who orders and receives, and a second person should check the count at least occasionally. The IRS's count sheet separates four jobs, counting, pricing, extending and proofreading, because each step can add an error and each one is easier to catch when someone else did the previous one.
Practical rules:
- A manager or lead counts, and the person who places the order does not count alone.
- Count blind where you can. If the counter sees the expected quantity, the count drifts toward it.
- Once a month, let someone from outside the kitchen, such as a manager from another location, count a few categories.
- Whoever counts, prices from invoices and not from memory.
None of this assumes anyone is dishonest. Most variance is portioning, miscounts and unrecorded waste, and a second pair of eyes finds those just as well.
How does inventory work across multiple locations?
Across locations, every kitchen counts the same list, in the same units, on the same day and time, and you compare variance by category and by location. With the same list, a gap between two restaurants is a real gap and not a difference in how they wrote things down.
Three things matter more as you add locations. First, transfers: when one location sends product to another, record it on both sides, or the sender looks wasteful and the receiver looks lucky. Second, prices: the same item has different invoice costs in different places, so value each location's stock at its own latest cost. Third, comparison: protein variance at 2% in one restaurant and 6% in another tells you where to send a manager. How to run a multi-location restaurant group covers the wider routine around that.
What should you check when variance is high?
Check the cheapest explanations first: the count, the cut-off date and the recipe costs, then portioning and receiving. RestaurantCalcs names over-portioning, waste and counting drift as the usual causes at 3% to 5%, and its ranked list of causes puts over-portioning first, then untracked waste and trim, then employee meals not rung in. This table is our own checklist:
| What you see | Likely cause | First check |
|---|---|---|
| One category high every week | Portion drift or an out-of-date recipe cost | Weigh ten plates against the recipe card and update the cost |
| One item short every week | Receiving, or a unit mix-up (case vs each) | Compare the delivery with the invoice and check the count unit |
| Variance swings positive and negative | Cut-off: invoices counted in a different week from the deliveries | Date every invoice to the week the product arrived |
| Variance jumps after a price or menu change | Stale recipe costs | Re-cost the dishes that changed |
| Bar high, food normal | Over-pouring or drinks not rung in | Compare bottle usage with drink sales |
Where Restaurant Codex fits
Restaurant Codex handles the counting and the paperwork around it. In Inventory, invoices are photographed and read line by line, price increases are flagged and duplicate invoices are stopped. Counts are blind and taken on the phone, with flags when stock doesn't add up. Waste is logged with a reason, the buying list is grouped by supplier and sent by email, WhatsApp or print, and food cost shows per location with a roll-up across all of them. You can start without a POS feed or recipe mapping.
Theoretical usage still needs your POS item sales and your recipe costs, and Codex isn't an accounting system, so the books stay where they are. At Quanto Basta in Mexico City, 28% margins have held consistently, with menu engineering and inventory giving more control over food cost and waste. More examples are on the customers page.
Restaurant Codex
The same checklist, on every phone, with photo proof
Restaurant Codex runs this template as a live task with timestamps, photos and one view across every location. Bring it to a 30-minute working session and we'll show you how it would run across your locations.
By the Restaurant Codex team
Written with operators who run multi-location restaurant groups. Reviewed against the FDA Food Code and the sources listed below.