What is a restaurant P&L?
A restaurant P&L, short for profit and loss statement, is a report of sales, costs and profit over a set period, and it answers one question: did the restaurant make money in those days? Accountants also call it an income statement. SpotOn notes it can cover a week, a month, a quarter or a year, and that each cost line is read as a percentage of sales. A $64,500 labor line means little until you know whether sales were $150,000 or $200,000.
The order never changes. SpotOn lists five groups: sales, cost of goods sold, labor, controllable costs and non-controllable costs, running from the most controllable to the least. The top line is net sales, which SpotOn defines as sales without sales tax but with comps and discounts taken into account. That is the money the dining room and the bar actually earned.
A P&L is not a cash report. A restaurant can show a profit in a period when it paid a large supplier bill late, or show a loss while the bank balance looks fine. KLR puts cash flow first in its list of common restaurant accounting mistakes, pointing to seasonal demand, changing payroll and vendor payments, and rising food costs. The P&L tells you whether the way you operate earns money. The bank balance tells you whether you can cover this week. The break-even guide covers which costs move with sales and which don't.
What does each line of a restaurant P&L mean?
Each line takes another bite out of net sales: cost of goods sold first, then labor, controllable costs and occupancy, then overhead, depreciation and interest, and what's left is profit before taxes. Here are four weeks (28 days) for a hypothetical full-service restaurant. Every number is invented, including the $8,400 for payroll taxes and benefits, which is a placeholder for your payroll provider's real figure.
| Line | Four weeks | % of net sales |
|---|---|---|
| Gross sales | $197,000 | |
| Comps and discounts | -$5,000 | |
| Net sales | $192,000 | 100.0% |
| Food | $43,500 | 22.7% |
| Beverage | $12,900 | 6.7% |
| Paper and packaging | $3,100 | 1.6% |
| Cost of goods sold | $59,500 | 31.0% |
| Gross profit | $132,500 | 69.0% |
| Hourly wages | $46,500 | 24.2% |
| Managers' salaries | $9,600 | 5.0% |
| Payroll taxes and benefits (assumed) | $8,400 | 4.4% |
| Total labor | $64,500 | 33.6% |
| Prime cost (memo: cost of goods sold + labor) | $124,000 | 64.6% |
| Utilities | $5,760 | 3.0% |
| Card processing fees | $5,000 | 2.6% |
| Marketing | $3,840 | 2.0% |
| Repairs and maintenance | $2,300 | 1.2% |
| Supplies and cleaning | $3,840 | 2.0% |
| Software and other | $2,000 | 1.0% |
| Controllable costs | $22,740 | 11.8% |
| Rent and common-area charges | $17,280 | 9.0% |
| Insurance and property tax | $3,000 | 1.6% |
| Occupancy | $20,280 | 10.6% |
| Restaurant operating profit | $24,980 | 13.0% |
| Owner and office overhead | $11,520 | 6.0% |
| Depreciation | $3,840 | 2.0% |
| Interest | $2,500 | 1.3% |
| Profit before taxes | $7,120 | 3.7% |
Prime cost is a memo line. You calculate it from two lines above and don't subtract it again.
Cost of goods sold is the food, beverage and paper you used, not what you bought. Restaurant365 gives the formula as starting inventory plus additional purchases minus ending inventory, so the counts at the start and end of the period decide this line. Labor is wages earned in the period plus payroll taxes, benefits and insurance, according to Restaurant365, and the labor cost guide walks through the arithmetic.
Prime cost adds those two. GSS calls 55% to 65% of sales healthy and above 68% a warning, and Restaurant365 puts the target at 60% to 65% for full-service and 55% to 60% for quick service. The example's 64.6% is inside GSS's range and at the top of Restaurant365's full-service band, which is a restaurant working but with no slack.
Controllable costs are the lines a manager can move period to period: utilities, card fees, marketing, repairs and supplies. Occupancy is fixed by the lease, and GSS lists a target of 6% to 10% of sales, so the example's 10.6% is a little high and can't be fixed from the kitchen. Restaurant operating profit is what the restaurant itself earns. Owner and office overhead, depreciation and interest belong to the business behind it, which is why they sit underneath.
What is a good restaurant profit margin?
WhippleWood CPAs puts a typical full-service profit margin at 3% to 8% of sales, and the National Restaurant Association's median for full-service restaurants in 2024 was 2.8% before taxes. The association's 2026 report adds that the same median was 4% in 2019, that limited-service restaurants reported a 4% median, and that 42% of operators said their restaurants weren't profitable in 2025.
Published ranges disagree, partly because they measure different things. WhippleWood lists 4% to 10% for fast casual and 5% to 12% for quick service, while its own FAQ gives 3% to 5% for full-service, so read the top of its range as the optimistic end. 7shifts gives 3% to 5% for full-service and 6% to 9% for quick service. SpotOn says the average is around 5%. None of them is wrong, but they aren't the same measurement.
Which margin you quote changes the answer. Here is the example restaurant three ways.
| Margin | Example | What it tells you |
|---|---|---|
| Gross profit | 69.0% | What's left after ingredients and paper; reflects menu prices and food cost |
| Restaurant operating profit | 13.0% | What the dining room earns before overhead, depreciation and interest |
| Profit before taxes | 3.7% | The figure the association's 2.8% median describes |
The same restaurant can honestly say 13% or 3.7%. Compare like with like, which means the pre-tax number against the published pre-tax medians.
Small moves are large against a margin this thin. Two points of food cost on $192,000 of sales is $3,840, which is 54% of the example's $7,120 profit. The cost rules guide checks where the common benchmarks come from.
What doesn't work is chasing a median. The median covers every size and format, so it can't tell you whether your 3.7% is good for your lease and your menu. Your own last four periods come first, then your other locations. The restaurant profit margin calculator does the arithmetic for one period.
How do you read a P&L across locations?
You read a P&L across locations by putting each one's lines side by side as a percentage of net sales, using the same lines, the same period and the same rules for what goes where. 7shifts says running a separate P&L per location lets you compare sites and quickly identify which one is underperforming and why. Here is the example restaurant (A) next to a second hypothetical location (B) for the same four weeks.
| Four weeks | Location A | Location B | Gap |
|---|---|---|---|
| Net sales | $192,000 | $168,000 | -$24,000 |
| Cost of goods sold | 31.0% | 30.5% | -0.5 pts |
| Labor | 33.6% | 37.5% | +3.9 pts |
| Prime cost | 64.6% | 68.0% | +3.4 pts |
| Controllable costs | 11.8% | 12.0% | +0.2 pts |
| Occupancy | 10.6% | 12.5% | +1.9 pts |
| Restaurant operating profit | 13.0% | 7.5% | -5.5 pts |
B's prime cost lands exactly on the 68% line GSS flags. Labor and occupancy together are 5.8 points worse at B, and cost of goods sold is half a point better, so those two lines explain more than the whole gap.
The percentages hide something the dollars show. B spent $63,000 on labor against A's $64,500, only $1,500 less on 12.5% lower sales, and its occupancy is $21,000 against $20,280. The P&L tells you which lines are off. It can't tell you whether B is overstaffed for its volume or just quiet this period. That answer lives in the schedule, the forecast and what happened that month.
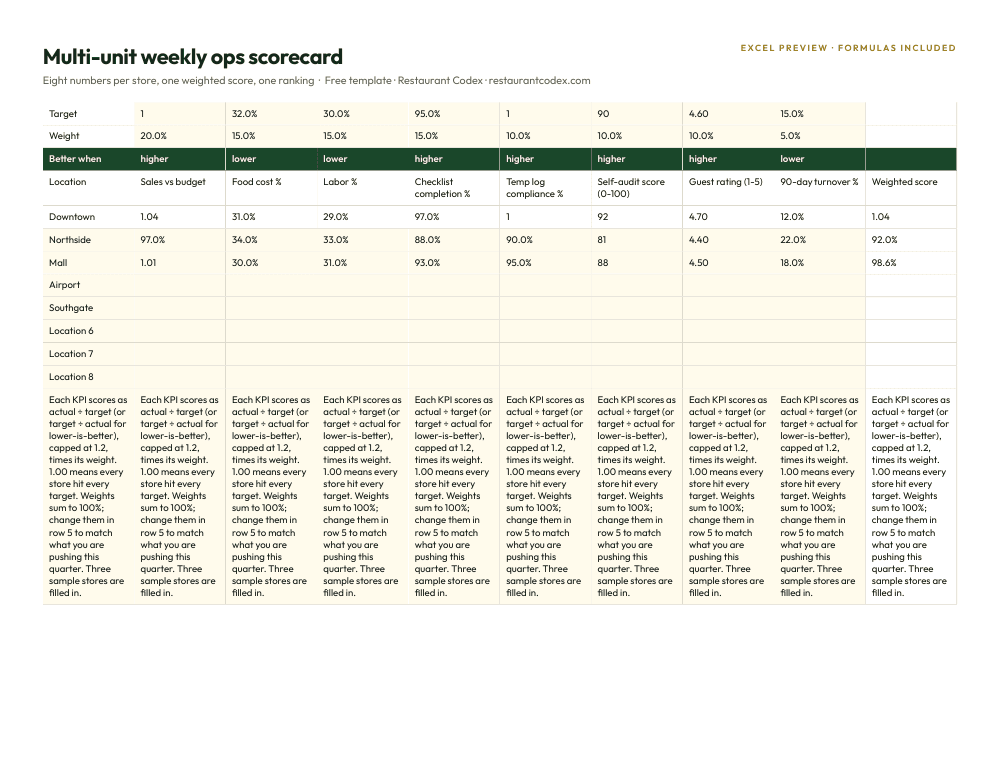
For the comparison to hold, a few rules need to be the same everywhere:
- The same chart of accounts, so "supplies" means one thing at every location.
- The same period. GSS recommends 13 four-week periods a year, each exactly 28 days, so a month with five weekends doesn't outsell a month with four.
- Manager salaries in labor at every location, including where an owner works the floor and takes no pay. Use what you'd pay someone else.
- The same handling of comps, discounts, gift cards and tax.
- Central costs allocated one way, or kept below the restaurant line.
What doesn't work is a combined P&L as the only view. It averages the strong location and the weak one into something that looks acceptable. The multi-location guide covers how the rest of the operation has to line up for these comparisons to mean anything.
Do you need a weekly flash P&L as well as a monthly one?
Yes: a weekly flash P&L shows what happened while you can still change it, and the period close shows what it actually cost. 7shifts recommends updating a P&L every week and notes that most owners review theirs monthly at minimum, and weekly if they want to catch problems early.
| View | What's in it | What's estimated | What it helps you decide |
|---|---|---|---|
| Daily flash | Sales, labor, comps, discounts, voids | Labor is the point-of-sale figure, not final payroll | Tomorrow's staffing and the night's problems |
| Weekly P&L | The main lines over seven days | Food cost, unless you count every week | Next week's schedule, portions and buying |
| Period close | Every line, with inventory counts and unpaid bills | Very little | Pricing, menu, rent and investment |
Restaurant365's documentation describes its flash report as a single day's performance for one or several locations, with gross sales, labor, comps, discounts, gift card redemptions, declared tips and voids, shown for the day, week to date and period to date. Its labor figures come from the point of sale. That's a good model for what to see every morning. GSS says to expect a preliminary P&L within 5 to 7 business days of period end and a final one within 10, so the close is for decisions about the quarter, not the week.


Take a hypothetical week. Labor on a $48,000 week lands at 37.0% when the period's average is 33.6%. That's 3.4 points, or $1,632. Seen on Monday, you can fix the next week's schedule. Seen in the close, it has repeated for weeks. The labor cost guide covers how to build the schedule from a forecast.
GSS makes the calendar point too: a month with five weekends will outperform a month with four regardless of how well anyone ran the days, so compare period to period, not calendar month to calendar month.
What are the most common restaurant P&L mistakes?
The most common restaurant P&L mistakes are guessing food cost without a count, keeping the books on a cash basis, reporting by calendar month and leaving things in sales or labor that don't belong there. Each one makes the P&L look cleaner than the restaurant is.
| Mistake | What it does to the P&L | The fix |
|---|---|---|
| Sales tax or gift card sales counted as sales | Inflates the top line, so every cost percentage looks lower (SpotOn on net sales; Baker Tilly on gift cards) | Net sales exclude tax; record gift cards as a liability until redeemed |
| No regular inventory count | GSS's example: $100,000 of weekly purchases with a 2% variance is $2,000 a week, $104,000 a year, and the P&L can't see it | Count on a fixed day every week or every period; see the inventory guide |
| Cash-basis books | Per GSS, hides unpaid invoices, accrued labor and upcoming vendor payments | Record costs when you incur them, not when you pay them |
| Calendar months | Months with five weekends beat months with four (GSS) | Use 13 four-week periods |
| Labor without payroll taxes or manager pay | Understates labor; the example's taxes and benefits are 4.4 points | Count everything Restaurant365 lists: wages, taxes, benefits, insurance |
| Personal and business money mixed | KLR calls it one of the most costly and damaging mistakes owners make; costs are misclassified and profit is unclear | Separate accounts and a clean owner draw line |
A tidy report cannot rescue bad books. GSS warns that accounting layered on top of uncorrected bookkeeping errors produces a P&L that looks complete but is structurally inaccurate. The order of fixing goes: the counts, the coding, the period, and then the report.
Where does Restaurant Codex fit?
Restaurant Codex doesn't produce a P&L. It isn't a point of sale, accounting or payroll system, so your statements stay in your accounting software and with your accountant. It also doesn't track labor.
What it does touches the lines of the P&L that start in the kitchen and storeroom. Inventory reads supplier invoices line by line and flags price increases, runs blind counts on the phone, logs waste with a reason, and shows food cost per location with a roll-up across all of them. That gives the cost-of-goods line a count behind it. The multi-location view puts locations side by side on daily lists and an end-of-day scoreboard, which compares how the work went, not the money.
Codex Copilot is an AI agent that can reach point-of-sale, accounting, payroll and scheduling tools through MCP. If your numbers live in those tools, that's the route to asking about them. The food waste and inventory guide shows what the counts look like in practice.
Restaurant Codex
The same checklist, on every phone, with photo proof
Restaurant Codex runs this template as a live task with timestamps, photos and one view across every location. Bring it to a 30-minute working session and we'll show you how it would run across your locations.
By the Restaurant Codex team
Written with operators who run multi-location restaurant groups. Reviewed against the FDA Food Code and the sources listed below.
Sources
- National Restaurant Association, State of the Restaurant Industry 2026 report
- WhippleWood CPAs, Restaurant Financial Benchmarks, updated April 2026
- SpotOn, How to Read a Restaurant P&L Statement + Free Template
- GSS, Restaurant P&L Statement Guide for Multi-Unit Restaurant Operators
- GSS, The Seven Restaurant Accounting Mistakes
- 7shifts, Free Restaurant P&L Template
- Restaurant365, How to Calculate Prime Cost in a Restaurant
- Restaurant365 documentation, Flash Report
- Baker Tilly, Balancing act: how to account for your restaurant gift cards
- Kahn Litwin (KLR), 5 Common Restaurant Accounting Mistakes