How do you calculate restaurant labor cost?
You calculate restaurant labor cost by dividing everything you paid for labor in a period by net sales for the same period, then multiplying by 100. Restaurant365 spells out what goes in the top number: salaries and hourly wages, payroll taxes, employee benefits and overtime. Most owners start with the wage line on the schedule, and that's why their number comes out lower than the one their accountant sees.
Here is a week for a hypothetical full-service restaurant with $48,000 in net sales. The numbers are invented, except the 7.65%, which is the employer share of Social Security (6.2%) and Medicare (1.45%) that the IRS lists on its Topic 751 page.
| Labor line | Amount |
|---|---|
| Regular hourly wages (640 hours) | $11,200 |
| Overtime (40 hours at $27, which is $18 × 1.5) | $1,080 |
| Salaried managers, one week's share | $2,300 |
| Employer Social Security and Medicare, 7.65% of $14,580 | $1,115 |
| Workers' compensation, unemployment taxes and benefits (assumed) | $900 |
| Total labor | $16,595 |
Total labor divided by sales is $16,595 ÷ $48,000 = 34.6%. Wages alone, $14,580 ÷ $48,000, come to 30.4%, so leaving out taxes and benefits hides 4.2 points. The $900 is a placeholder: unemployment tax rates and workers' compensation premiums vary by state and by your claims history, so take the real figure from your payroll provider.
For a sense of where 34.6% sits, WhippleWood CPAs, citing Bureau of Labor Statistics and National Restaurant Association 2026 data, puts the full-service median at 36.5% of sales and profitable operators at 34.2%. Restaurant365 gives targets by concept: about 25% for quick service, 25% to 30% for casual dining and 30% to 35% or more for fine dining. The two sets disagree because one is what operators aim for and the other is what operators actually posted.
Those few points matter because margins are thin. The association's report puts median income before taxes at 2.8% of sales for full-service respondents in 2024 and 4% for limited-service. On the example week, 2.8% is $1,344. A labor line that is two points off, $960, takes most of it.


Labor is half of prime cost, and the cost rules guide shows how it combines with food cost and where the usual rules of thumb break.
How do you lower labor cost without hurting service?
You lower labor cost without hurting service by changing when people work and how long it takes new people to get good, not by trimming the same percentage off every shift. The pressure is real. The National Restaurant Association's 2026 report says labor costs rose 35% from 2019 to the end of 2025, and only 16% of operators said their average staffing was higher in 2025 than in 2024, against 35% who said it was lower. Many are already running lean.
The same report says 3 in 4 operators describe their restaurants as more efficient than before the pandemic. The levers that tend to work are the ordinary ones, each with a way to go wrong.
| Lever | What it changes | Where it backfires |
|---|---|---|
| Schedule from a forecast by daypart | Hours follow expected sales, not last week's schedule | A forecast that ignores a closed road or a big event is wrong in both directions |
| Cut early in a set order | Hours drop on the slow nights as they happen | If the order isn't posted in advance, staff read it as favoritism |
| Cap overtime | The week's hours get balanced before anyone crosses 40 | Moving hours to a second person means a second person who is trained for that station |
| Cross-train | One person covers two stations in a quiet daypart | It takes weeks and a written standard; see the staff training guide |
| Shorten the learning curve | New hires reach standard sooner, so fewer paid hours are shadowing | Needs recipes, SOPs and a sign-off that someone actually does |
| Reduce turnover | Fewer replacements to recruit, train and carry at half speed | Takes manager time before it pays back; see the onboarding and turnover guide |
What doesn't work is cutting hours until the percentage looks right in a slow week. A restaurant needs an opener, a line cook and a dishwasher whether it sells $2,000 or $4,000 that day, so labor is partly fixed. Cut below that floor and tickets slow down, tables turn slower, sales fall and the percentage climbs again. Percentages are fixed by sales as much as by hours.

How should you schedule to a sales forecast?
You schedule to a sales forecast by predicting sales for each daypart, turning that into labor hours with a target sales per labor hour, and building the schedule from those hours instead of copying the last one. It sounds like more work than it is, and a spreadsheet handles it fine.
- Forecast each daypart. Average the same daypart on the same weekday for the last four to eight weeks, then adjust for what you know: a holiday, a concert, a closed road, a new competitor.
- Convert sales to hours. Divide forecast sales by your target sales per labor hour. Use your own history for the target, by daypart, since no trade association publishes a standard figure that we could find.
- Build the schedule by station. Put the hours where the work is, not evenly across the shift.
- Set the cut order before the shift. Who goes first when covers are running short, written down and known to the team.
- Check at a fixed point in the shift. If sales are 15% under forecast at a set time, start the cuts.
- Compare scheduled hours with worked hours each week. The gap is where the money leaks.
An invented example: the last four Fridays at dinner sold $8,600, $9,200, $8,900 and $9,300, an average of $9,000. With a target of $75 per labor hour, that's 120 hours. If last Friday's schedule carried 138, the extra 18 hours cost about $315 at a $17.50 average wage, and probably didn't make the food come out faster.
The tool matters less than the habit. Scheduling software does the forecast and the cut list automatically, and our comparison with 7shifts covers where that kind of product ends and a task and training system begins. A shared spreadsheet and a manager who looks at it every week works too.
How do overtime rules affect labor cost?
Under federal law, overtime starts after 40 hours in a workweek and costs one and a half times the employee's regular rate, so how you spread hours across the week changes the bill. The Department of Labor's Fact Sheet #23 defines a workweek as a fixed, regularly recurring period of 168 hours, seven consecutive 24-hour periods, and says the Fair Labor Standards Act doesn't require overtime for work on Saturdays, Sundays, holidays or regular days of rest, as such. Only hours past 40 count.
State rules can be stricter. California requires one and a half times the regular rate for hours past 8 up to 12 in a workday, and double time past 12, according to the state's Department of Industrial Relations. The first 8 hours on a seventh consecutive day in a workweek are also paid at one and a half times, with double time past 8 on that day. A California restaurant can owe overtime to someone who never reaches 40 in the week.
Three more rules change restaurant math:
- Tipped staff. When an employer takes a tip credit, the Department of Labor says overtime must be calculated on the full minimum wage, $7.25 an hour federally, not on the lower cash wage.
- Salaried managers. Fact Sheet #17A lists a salary of at least $684 a week for the executive exemption, plus duties tests. A title doesn't decide it. Check the current level before you rely on it, because it has been the subject of rulemaking.
- Employer taxes. Social Security (6.2%) and Medicare (1.45%) on the employer side apply to overtime pay too, per the IRS.
A small example with invented pay. A cook at $18 an hour works 46 hours: 40 × $18 = $720, plus 6 × $27 = $162, for $882. Without overtime those 46 hours would cost $828, so overtime added $54. If the same 6 hours go to a second cook who is at 30 hours, they cost 6 × $18 = $108 instead of $162. That's $54 saved on the week, and it only works if the second cook can run the station.
This is a summary, not legal advice. State and city rules vary, so check yours with your state labor department or an employment lawyer.
How do you control labor cost across several locations?
Across several locations you control labor cost by comparing each location with its own target and its own history, because the same percentage means different things at a $30,000 week and a $60,000 week. A minimum crew costs about the same at both, so the smaller location always looks worse on the percentage.
| Week (invented) | Location A | Location B |
|---|---|---|
| Net sales | $60,000 | $30,000 |
| Total labor | $19,800 | $12,900 |
| Labor cost % | 33.0% | 43.0% |
| Hours worked | 810 | 500 |
| Sales per labor hour | $74.07 | $60.00 |
Location B's 43.0% doesn't tell you whether the manager is doing something wrong. The questions that do are whether B's percentage was 43.0% four weeks ago too, whether its hours followed its forecast, and whether its sales per labor hour moved. A location that goes from 38% to 43% with flat sales has a scheduling problem. A location that has sat at 43% for a year has a volume problem, and the fix is on the sales side or in the minimum crew.
Three habits keep the comparison honest:
- One definition. Decide whether managers, taxes and benefits are in the number, and use it everywhere.
- Same period. Compare pay weeks to pay weeks, not a week against a month.
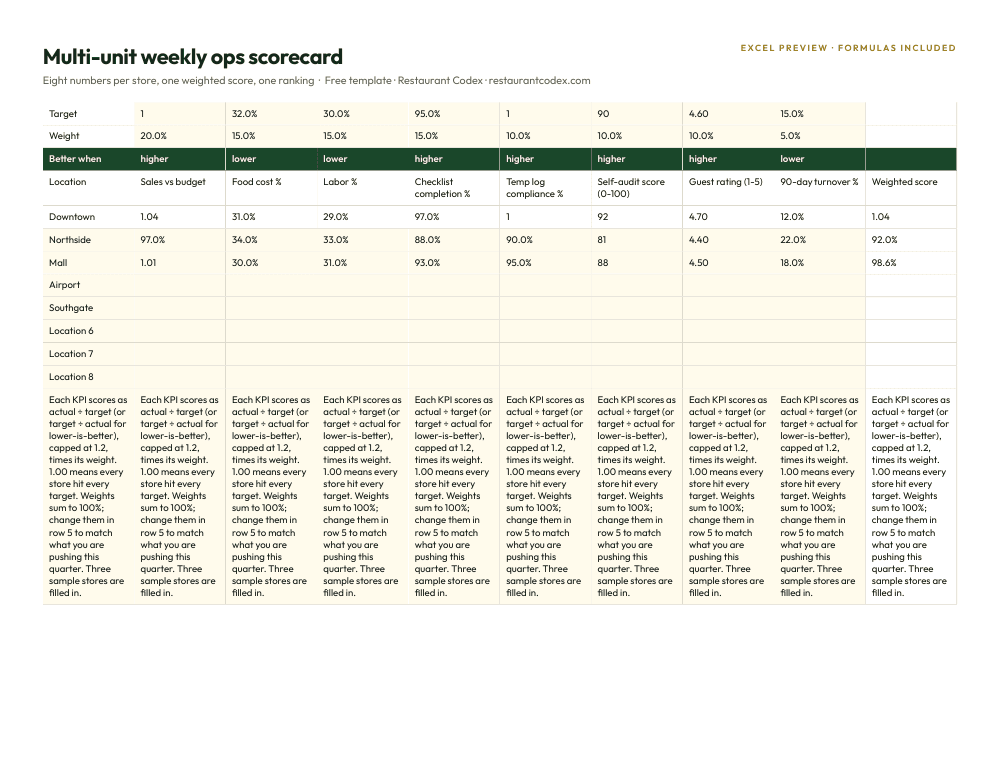
- Side by side, weekly. The multi-unit weekly scorecard is a place to put labor next to the other numbers each manager answers for.
The multi-location group guide covers the wider question of what a head office should review and how often.
What is sales per labor hour, and which other labor numbers matter?
Sales per labor hour is net sales divided by the hours worked in the same period, and it shows how much each hour of staff time produced. In the example week, $48,000 ÷ 680 hourly hours (640 regular plus 40 overtime) is $70.59. No trade association publishes a standard figure that we could find, so the useful comparison is your own history by daypart and weekday.
A short list is enough, and each number answers a different question.
| Metric | Formula | Example week | What to watch |
|---|---|---|---|
| Labor cost % | Total labor ÷ net sales | $16,595 ÷ $48,000 = 34.6% | A rise over three weeks with flat sales |
| Sales per labor hour | Net sales ÷ hours worked | $48,000 ÷ 680 = $70.59 | A fall by daypart, not by week |
| Overtime share | Overtime hours ÷ total hours | 40 ÷ 680 = 5.9% | Creeping up before busy seasons |
| Labor cost per cover | Total labor ÷ covers | $16,595 ÷ 1,500 = $11.06 | Check size changes move this too |
| Schedule against worked hours | Worked − scheduled | 680 − 665 = +15 hours (2.3%) | The same person or shift every week |
| Prime cost | (Food and beverage cost + labor) ÷ sales | See the cost rules guide | Above the range for your concept |
Look at hours before dollars. Hours are what a manager controls on the day, and dollars follow from hours and pay rates. Turnover belongs next to this list, since each replacement is hours of reduced output and paid training; the onboarding and turnover guide has the numbers.
Where Restaurant Codex fits
Restaurant Codex isn't a scheduling, payroll or time-clock system, and it doesn't track labor hours or labor cost. Those numbers stay in your scheduling tool, your POS and your payroll provider, and the calculations above are things you bring to them.
What it touches is the part of labor cost that depends on how fast people get good. Training and LMS gives each role a learning path in the staff app on the first day, with tests and a manager's sign-off at the station, and shows readiness by location, role and path. Operations puts location performance side by side with an end-of-day scoreboard. Codex Copilot can reach scheduling, accounting and POS tools through MCP when your group wants questions answered across them.
Restaurant Codex
The same checklist, on every phone, with photo proof
Restaurant Codex runs this template as a live task with timestamps, photos and one view across every location. Bring it to a 30-minute working session and we'll show you how it would run across your locations.
By the Restaurant Codex team
Written with operators who run multi-location restaurant groups. Reviewed against the FDA Food Code and the sources listed below.
Sources
- National Restaurant Association, State of the Restaurant Industry 2026 report
- WhippleWood CPAs, Restaurant Financial Benchmarks, updated April 2026
- Restaurant365, How To Calculate Restaurant Labor Costs Percentage
- U.S. Department of Labor, Fact Sheet #23: Overtime Pay Requirements of the FLSA
- U.S. Department of Labor, Fact Sheet #15: Tipped Employees Under the FLSA
- U.S. Department of Labor, Fact Sheet #17A: Exemption for Executive, Administrative, Professional and Computer Employees
- California Department of Industrial Relations, Frequently Asked Questions on Overtime
- IRS, Topic no. 751, Social Security and Medicare withholding rates