What is a restaurant's break-even point?
A restaurant's break-even point is the level of sales at which revenue equals total costs, so the period ends with no profit and no loss. OpenStax's managerial accounting text puts it as the point where a business is neither losing nor making money, and adds a warning: "No business can operate for very long below break-even."
It's a floor and not a goal. At break-even the owner earns nothing from the business, and a restaurant that hits the number exactly has no cushion for a slow week. The National Restaurant Association's State of the Restaurant Industry 2026 report says 42% of operators reported their restaurant was not profitable in 2025, which is the reason owners work this number out before a lease is signed and again whenever a cost moves.
How do you calculate break-even sales and covers?
You calculate break-even sales by dividing monthly fixed costs by the contribution margin ratio, then get covers by dividing those sales by your average check. The contribution margin ratio is what is left of each sales dollar after variable costs, written as 1 minus variable costs as a share of sales.
OpenStax shows the same formulas on an accounting firm: $14,000 of fixed costs and $250 contribution per return gives 56 returns, and $14,000 divided by a 0.625 ratio gives $22,400 in sales. Here is a restaurant version, with invented numbers for a 60-seat full-service place.
| Fixed cost, per month | Amount |
|---|---|
| Rent | $12,000 |
| Salaried managers (general manager, kitchen manager), with payroll taxes | $13,500 |
| Loan payment | $4,000 |
| Base utilities | $2,800 |
| Insurance | $1,500 |
| Repairs and maintenance | $1,200 |
| Marketing | $1,000 |
| Software and subscriptions | $900 |
| Accounting and licenses | $800 |
| Total fixed | $37,700 |
| Variable cost, share of sales | Percent |
|---|---|
| Food and beverage cost | 31% |
| Hourly labor | 20% |
| Card processing fees | 2.5% |
| Supplies, packaging and other | 3.5% |
| Total variable | 57% |
The contribution margin ratio is 100% minus 57%, which is 43%. Then:
- Break-even sales: $37,700 ÷ 0.43 = $87,674 a month, which is $20,233 a week or $3,372 on each of 26 open days.
- Break-even covers: $87,674 ÷ $38 average check = 2,307.2, so 2,308 covers a month, about 89 a day. In a 60-seat room that is roughly 1.5 turns a day.
- With a profit target of $8,000 a month: ($37,700 + $8,000) ÷ 0.43 = $106,279 in sales, 2,797 covers, about 108 a day.
Profit at different sales levels shows how the same fixed costs behave:
| Monthly sales | Profit | Total labor % | Prime cost % |
|---|---|---|---|
| $70,000 | -$7,600 | 39.3% | 70.3% |
| $87,674 | $0 | 35.4% | 66.4% |
| $100,000 | $5,300 | 33.5% | 64.5% |
| $120,000 | $13,900 | 31.2% | 62.3% |
Total labor is the managers' $13,500 plus 20% of sales, and prime cost is food cost plus total labor. WhippleWood CPAs, citing National Restaurant Association 2026 figures, gives 28% to 35% of sales as the usual food cost range, 32.4% as the full-service average and 55% to 65% for prime cost. The example restaurant lands inside the prime cost range only from about $100,000 a month, because the fixed manager salaries weigh heavily on slow months. At $100,000 the cushion above break-even is 12.3% of sales.
OpenStax lists the assumptions behind the method: costs are linear and clearly fixed or variable, the selling price stays constant, the sales mix stays constant and everything holds inside a relevant range. A restaurant bends all of them a little, so treat the answer as a good estimate and not an exact line.


What are fixed and variable costs in a restaurant?
Fixed costs are the ones that stay the same whatever you sell in the month, and variable costs are the ones that move with sales. Rent, salaried managers, insurance, loan payments, software and base utilities are fixed. Food, beverage, packaging and card fees are variable. Some costs sit in between, and how you place them changes the answer.
| Cost | Behavior | How to treat it |
|---|---|---|
| Rent, insurance, loan payment | Fixed | Fixed costs |
| Salaried managers | Fixed | Fixed costs |
| Owner's pay, if you work in the restaurant | Fixed | Fixed costs, at a salary you would accept |
| Food, beverage, packaging | Variable | Percent of sales |
| Card processing fees | Variable | Percent of sales |
| Hourly labor | Mixed: a minimum crew regardless of sales, more people as sales rise | Variable in this guide; split it into a fixed floor and a variable part if you want more accuracy |
| Utilities | Mixed: a base load plus use | The base as fixed, or the whole bill as fixed for simplicity |
| Repairs and maintenance | Mixed | Average it as fixed |
The hourly labor line matters most. A kitchen needs a crew to open the doors at all, so on a slow day labor behaves like a fixed cost. Treating hourly labor as fully variable flatters the break-even at low volume, and the 20% in the example is a simplification. Whatever rule you pick, keep it the same from month to month, or your break-even will change because of bookkeeping and not because of the business.
How long does a restaurant take to break even?
No single published figure says how long a restaurant takes to break even, because it depends on your fixed costs, how fast sales build and how much cash you have to cover the gap. What the evidence does give is a range from large chains and a measure of how often independents change hands.
BJ's Restaurants, a US chain of more than 200 full-service restaurants, says in its fiscal 2025 annual report that "all of our new restaurants usually require a year or longer after opening to reach their targeted restaurant-level operating profit." It adds that new restaurants often open above their sustainable sales, and that it "may take up to three years until a new restaurant's sales eventually settle at a more predictable and sustainable level," with maturation periods that "generally range from two to five years." That is a large chain with a corporate balance sheet, so an independent with one lease will feel the same curve more sharply.
The best-known study of independents is Parsa and co-authors' 2005 look at 2,439 operating-license permits in Columbus, Ohio from 1996 to 1999. They found 26.16% of restaurants changed ownership in the first year, 19.23% in the second and 14.35% in the third, 59.74% in total over three years, with 61.4% for independents and 57.2% for chains. Ownership turnover isn't the same as closing, and the data is from one city decades ago. It shows how often the first years end in a change, and not how long break-even takes.
Two practical ways to answer for your own restaurant:
- Work out the monthly break-even before you open, then model a ramp as in the next section and see how many months of losses your cash can take.
- Keep monthly break-even separate from payback. Break-even asks whether a month covers its costs. Payback asks how long profit takes to return your investment, and the loan payment in the fixed costs above already counts part of that.
What does break-even look like for a new location?
For a new location, break-even is the same formula, but sales start below it and take months to climb, so the real question is how much cash the climb consumes. Here is the example restaurant opening with invented ramp numbers, going from 60% to 100% of a $100,000 mature month, with the same 43% contribution margin and $37,700 of fixed costs.
| Month | Sales | Profit or loss | Cumulative |
|---|---|---|---|
| 1 | $60,000 | -$11,900 | -$11,900 |
| 2 | $68,000 | -$8,460 | -$20,360 |
| 3 | $76,000 | -$5,020 | -$25,380 |
| 4 | $83,000 | -$2,010 | -$27,390 |
| 5 | $89,000 | $570 | -$26,820 |
| 6 | $94,000 | $2,720 | -$24,100 |
| 7 | $98,000 | $4,440 | -$19,660 |
| 8 | $100,000 | $5,300 | -$14,360 |
The month-by-month result turns positive in month 5, when sales pass $87,674. The cumulative result stays negative until about month 11, and that is before any pre-opening spending. BJ's reports pre-opening expense of about $0.7 million for its new restaurant in fiscal 2025, covering six to eight managers and about 150 hourly team members hired and trained before opening. An independent's number will be far smaller, but the item exists: wages, training and rent are paid before the first guest arrives.
The example is kind in two ways. A new restaurant tends to run a higher food cost and heavier labor while the crew learns the menu, so the 43% margin would be lower in the early months. And BJ's notes the opposite risk too, that opening sales can run above what is sustainable. If you are opening a second restaurant, opening a second restaurant location covers the planning around it.
How do you lower the break-even point?
You lower the break-even point by cutting fixed costs, raising the share of each sale that is left after variable costs, or raising the check. Each lever changes the example restaurant by a different amount:
| Change | New break-even sales | Change vs $87,674 | New break-even covers |
|---|---|---|---|
| Raise the average check from $38 to $40 with the same plate cost | $82,225 | -6.2% | 2,056 |
| Cut food cost from 31% to 29% | $83,778 | -4.4% | 2,205 |
| Cut hourly labor from 20% to 18% | $83,778 | -4.4% | 2,205 |
| Cut fixed costs by $2,000 a month | $83,023 | -5.3% | 2,185 |
| Food cost and hourly labor each down 2 points | $80,213 | -8.5% | 2,111 |
Raising the check helps covers the most, but it assumes the price rise doesn't lose guests, which is a test and not a given. Menu engineering is the way to find which dishes can carry a higher price. Food cost points come from portions, yields, purchasing and waste. Fixed costs are the slowest to move, since rent and loan terms are set by contract, so look at what can be renegotiated, shared or dropped, such as unused subscriptions and insurance quotes.
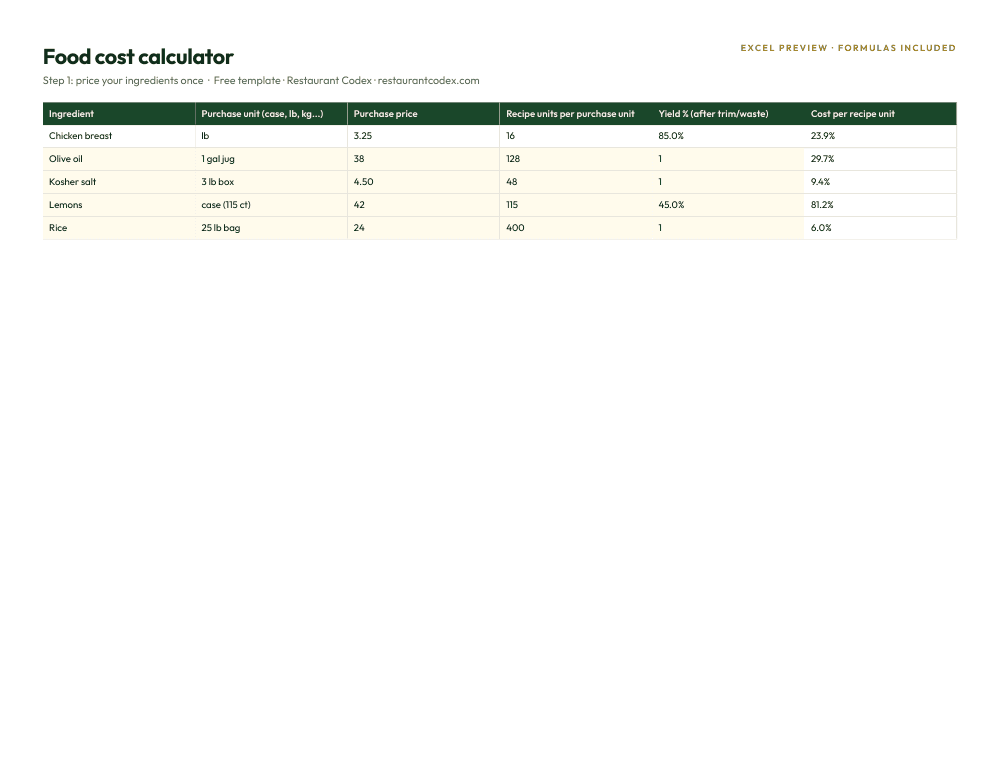
Use the restaurant profit margin calculator to test your own numbers, and the food cost calculator below for the plate level.
What should you check every week once you know the number?
Once you know your break-even, check each week's sales against its weekly equivalent and watch prime cost, since both tell you early whether the month is on track. At $87,674 a month the weekly line is $20,233. A week at $17,000 doesn't sink a month, but three in a row does.
The tracker above is built for this: sales, food cost and labor by week, with prime cost worked out. Review it on the same day each week. Restaurant cost rules of thumb lists the ranges to hold the numbers against.
Where Restaurant Codex fits
Restaurant Codex helps with the food cost side of the break-even, which is usually the biggest variable cost. Inventory reads supplier invoices line by line, flags price increases, runs blind counts on the phone, logs waste with a reason and shows food cost per location with a roll-up across all of them. It doesn't track labor, run your books or work out break-even. Those stay in your accounting and your tracker, and the guide's numbers are for you to bring.
At Quanto Basta in Mexico City, 28% margins have held consistently, with menu engineering and inventory giving more control over food cost and waste. More examples are on the customers page.
Restaurant Codex
The same checklist, on every phone, with photo proof
Restaurant Codex runs this template as a live task with timestamps, photos and one view across every location. Bring it to a 30-minute working session and we'll show you how it would run across your locations.
By the Restaurant Codex team
Written with operators who run multi-location restaurant groups. Reviewed against the FDA Food Code and the sources listed below.
Sources
- OpenStax, Principles of Accounting Volume 2: Managerial Accounting, 3.2 Calculate a Break-Even Point in Units and Dollars
- National Restaurant Association, State of the Restaurant Industry 2026
- BJ's Restaurants, Inc., Form 10-K for fiscal year 2025 (SEC)
- Parsa, Self, Njite and King (2005), Why Restaurants Fail, Cornell Hotel and Restaurant Administration Quarterly 46(3)
- WhippleWood CPAs, Financial Benchmarks for Restaurants